“All human knowledge is uncertain, inexact, and partial.” – Bertrand Russell
Last week , we had three days intensive course – AI for Managers in ESMT Berlin 📚. I like to call them workshops for management . They aim to solve business problems with machine learning knowledge. I love ❤️ the process from a business problem into actionable real business decision.
But professor only allowed use an “ancient calculator” 🧮️ to get the real answer in exam 😅. It is tough 💪, but memorable ⭐. I only write down several sessions which I had new insights.
#1 Start Simple, Combine Strategically
You don’t need deep learning or neural networks for most business problems. Classical ML methods (logistic regression, clustering, factor analysis) are:
- Interpretable — you can explain the results to non-technical stakeholders
- Fast — run in seconds, iterate quickly
- Powerful when combined — 1+1+1 = 10
#2 The Real Skill Is Interpretation
Running the algorithm is the easy part. The hard part is:
- Naming factors meaningfully (not just “Factor 1, Factor 2”)
- Interpreting cluster profiles (turning numbers into customer personas)
- Translating coefficients into business recommendations
Machine learning amplifies your judgment, it doesn’t replace it.
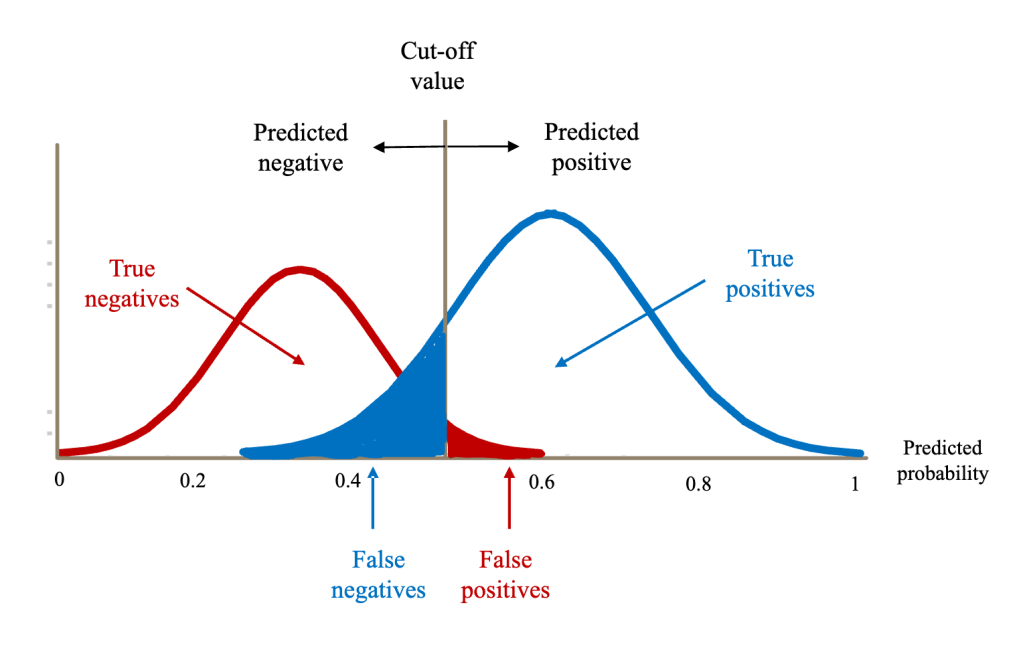
As management, you need to make trade-offs, cut-off value.
#3: All Models Are Wrong, But Some Are Useful
The course drilled this into us from day one. No algorithm gives you “the answer.” Machine learning models offer insights, patterns, and probabilities—but you still need to make the decision. The real skill isn’t running the algorithm. It’s knowing when to trust it, when to question it, and how to combine it with business knowledge.
What this means in practice in class:
- Factor Analysis told us there are preference dimensions—but WE named them and interpreted what they meant
- K-means gave us customer clusters—but WE decided how to target each segment
- Logistic Regression predicted who would like the product—but WE chose the marketing strategy
#4: Integration Beats Perfection
Instead of searching for the “perfect” ML method, we learned to chain multiple simple techniques together.
Think of it like cooking: you don’t need one magical ingredient. You need the right combination of ingredients, each serving its purpose.
In the course, Microvan project:
- Factor Analysis = Prep work (cleaning and organizing ingredients)
- Clustering = Understanding your audience (who are we cooking for?)
- Logistic Regression = The final dish (what will they love?)
Alone, each method gives limited insight. Together, they create a complete strategy.
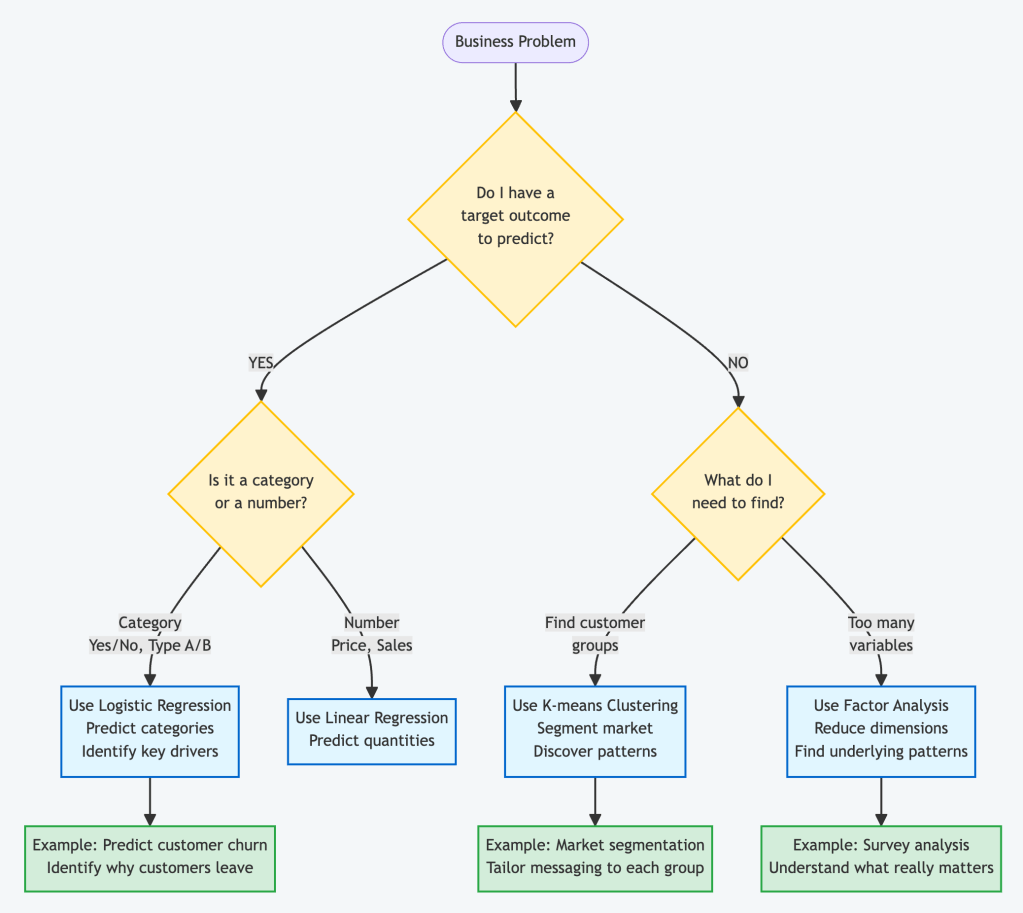
#3 A Practical Business Decision Framework
The key insight: Most real business problems need MULTIPLE methods working together.
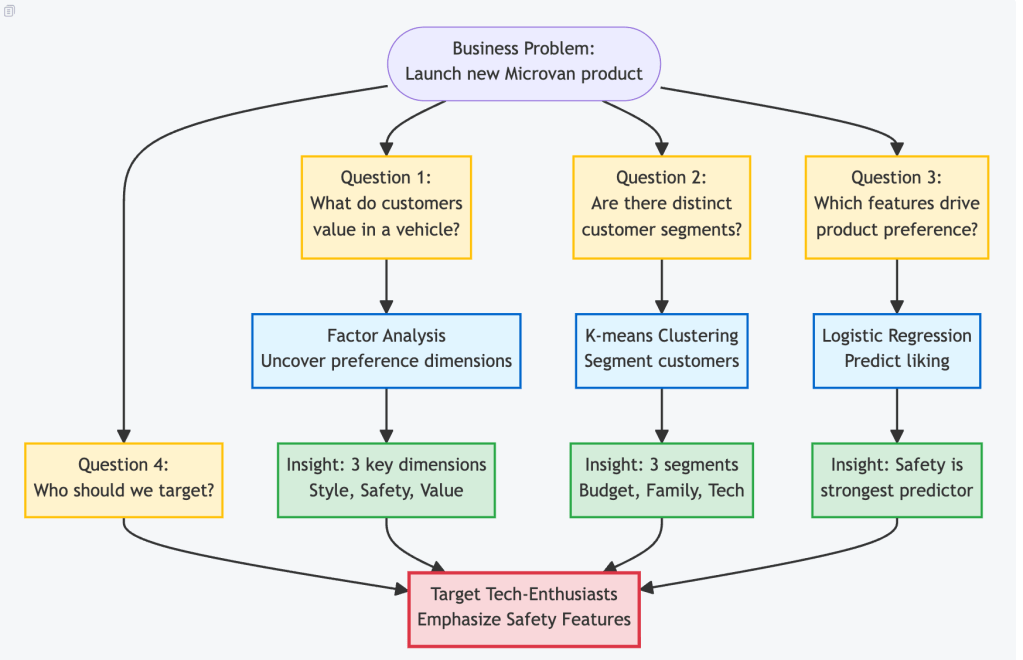
#5 A Real World Automotive Case
The Challenge
Our automotive company was developing a new Microvan. We had:
- Survey data from 500 potential customers
- 15 different vehicle feature ratings (style, safety, price, etc.)
- One crucial question: Who should we target, and what should we emphasize?
The Problem We Faced
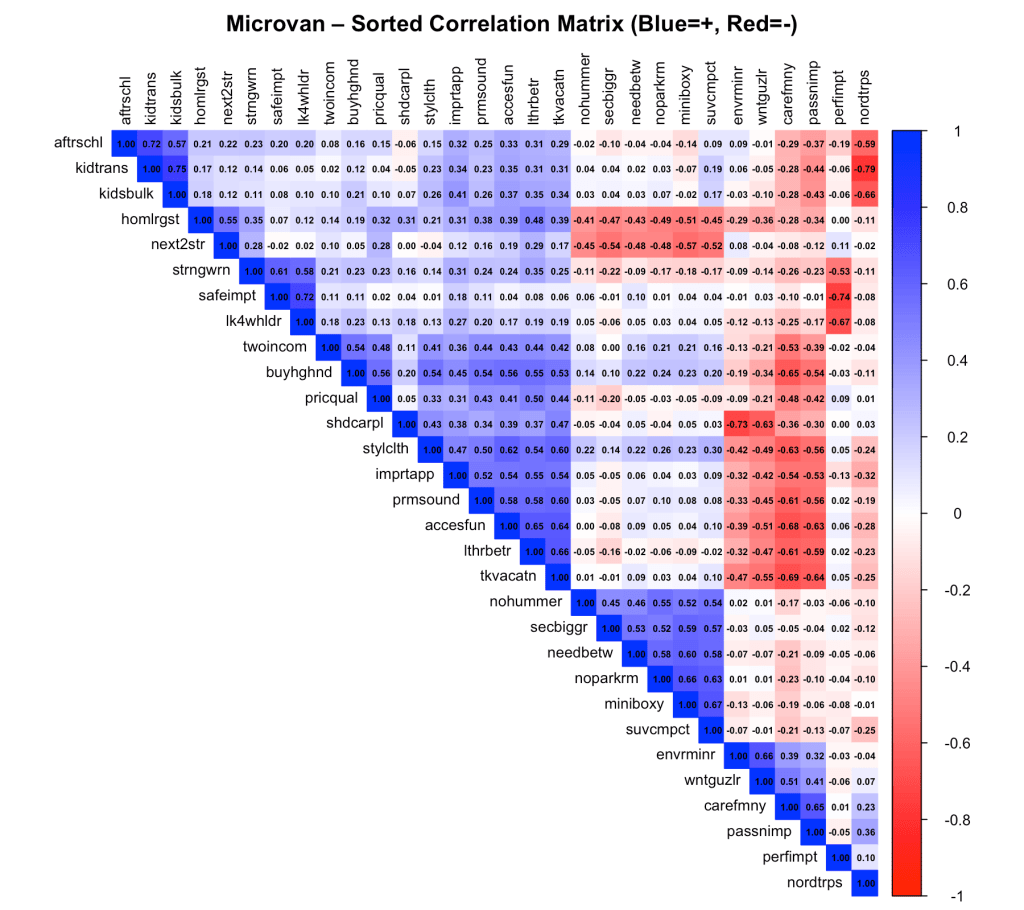
Looking at 15 different variables was overwhelming. Customers who liked “modern design” also liked “sporty appearance” and “interior space”—everything was correlated. We couldn’t just build a regression model because of high correlation (when variables are too similar, the model gets confused).We learned a systematic problem solving.
How We Solved It
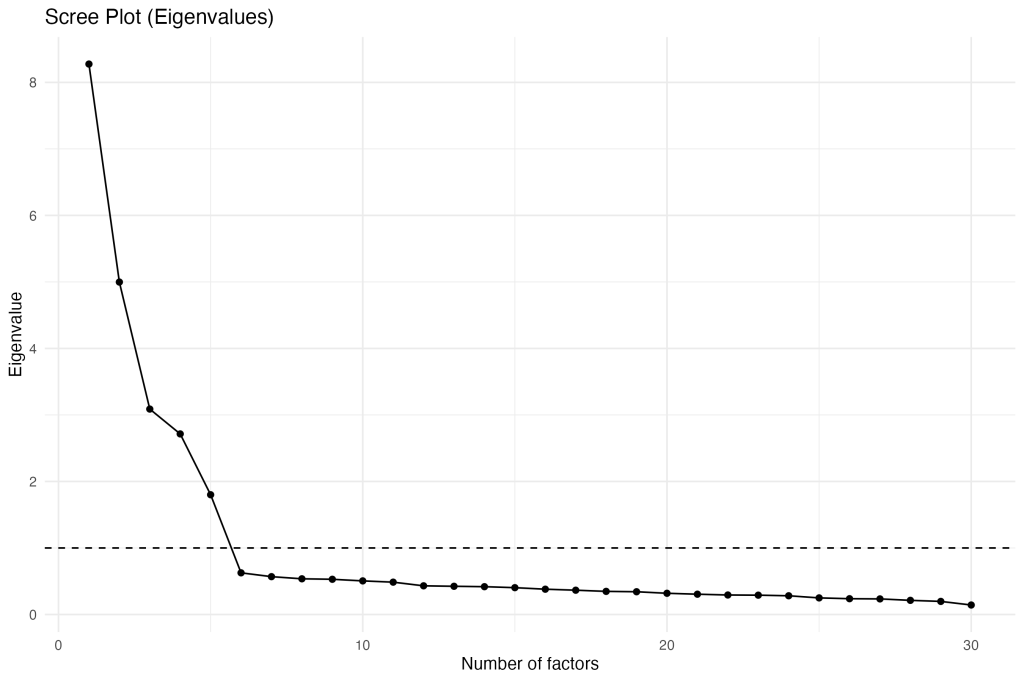
Phase 1: Understanding What Customers Really Care About (Factor Analysis)
The Question: “What are the underlying preference dimensions?”
What We Did: Instead of looking at 15 separate features, we used Factor Analysis to find underlying patterns.
Key Insight: Customers don’t think about 15 separate features. They think about Style, Safety, and Value. This simplified everything. Mathematical: We converted each customer’s 15 ratings into 5 “factor scores”—a much cleaner dataset.
Regression model
==========================================

Call: lm(formula = mvliking ~ F1 + F2 + F3 + F4 + F5, data = scores)

Coefficients:
            Estimate Std. Error t value             Pr(>|t|)
(Intercept)   4.8425     0.1102  43.925 < 0.0000000000000002 ***
F1            1.0277     0.1104   9.311 < 0.0000000000000002 ***
F2            0.9989     0.1104   9.049 < 0.0000000000000002 ***
F3            0.2091     0.1104   1.894               0.0589 .
F4           -0.1729     0.1104  -1.566               0.1181
F5           -0.5545     0.1104  -5.023          0.000000772 ***
---
Signif. codes:  0 ‘***’ 0.001 ‘**’ 0.01 ‘*’ 0.05 ‘.’ 0.1 ‘ ’ 1

Residual standard error: 2.205 on 394 degrees of freedom
Multiple R-squared:  0.3365,    Adjusted R-squared:  0.3281
F-statistic: 39.97 on 5 and 394 DF,  p-value: < 0.00000000000000022
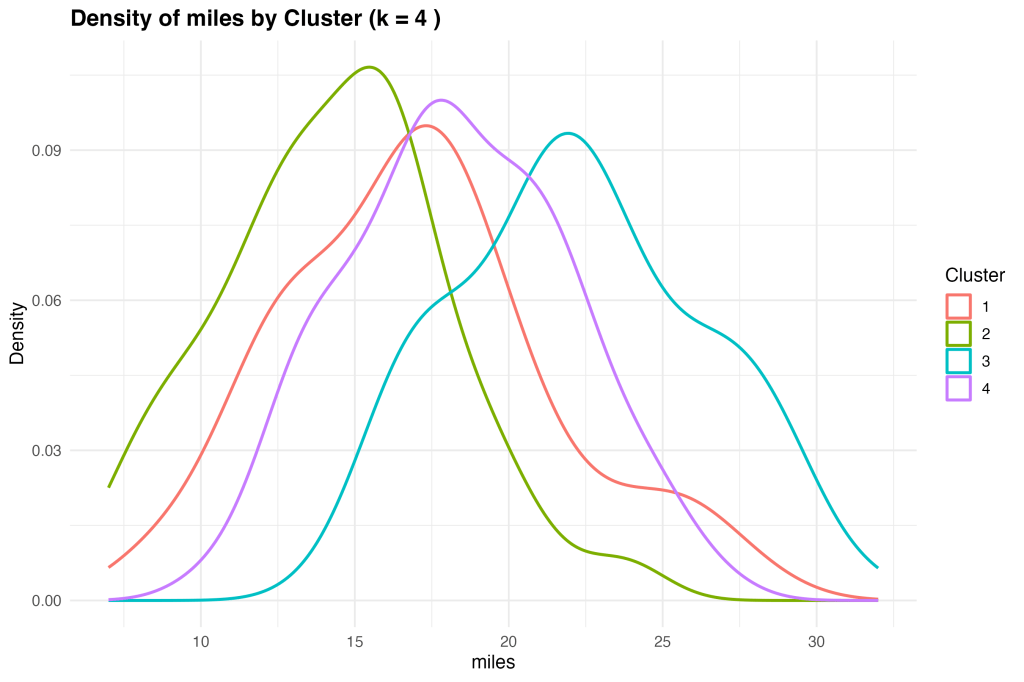
Phase 2: Discovering Customer Segments (K-means Clustering)
The Question: “Are there distinct types of customers?”
What We Did: Using those factor scores, we ran K-means clustering to find natural customer groups.
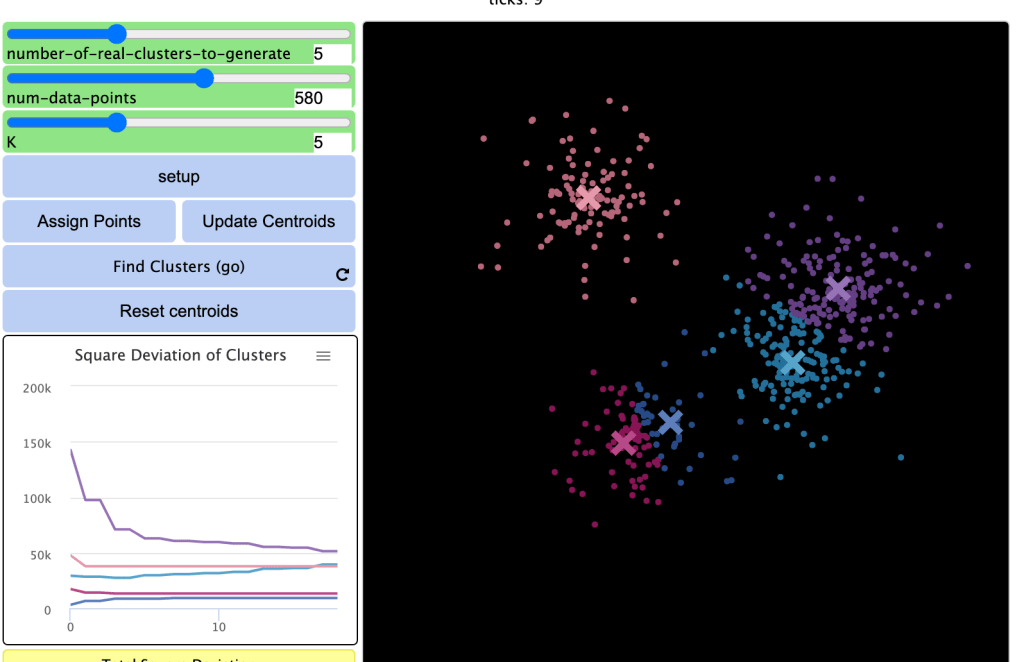
With these data, we converted into a real persona matrix
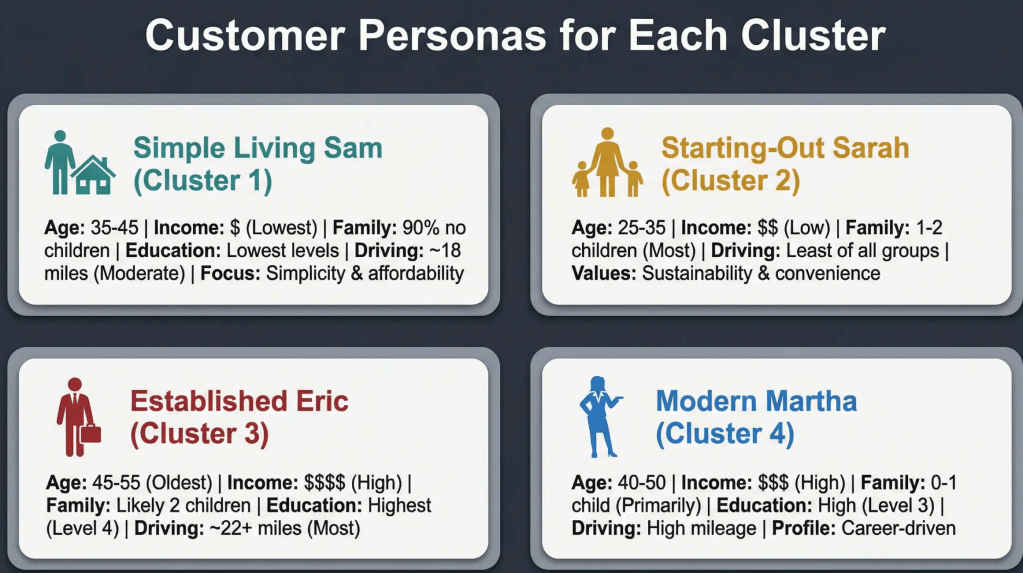
| Cluster centers (z-score means on factors), k = 4 | |||||
| Cluster | F1 | F2 | F3 | F4 | F5 |
| 1 | -0.78 | 0.15 | 0.44 | -0.03 | -1.30 |
| 2 | -0.89 | 0.05 | -0.51 | -0.64 | 0.37 |
| 3 | 0.68 | 1.17 | 0.21 | 0.37 | 0.25 |
| 4 | 0.63 | -1.13 | 0.07 | 0.28 | 0.10 |
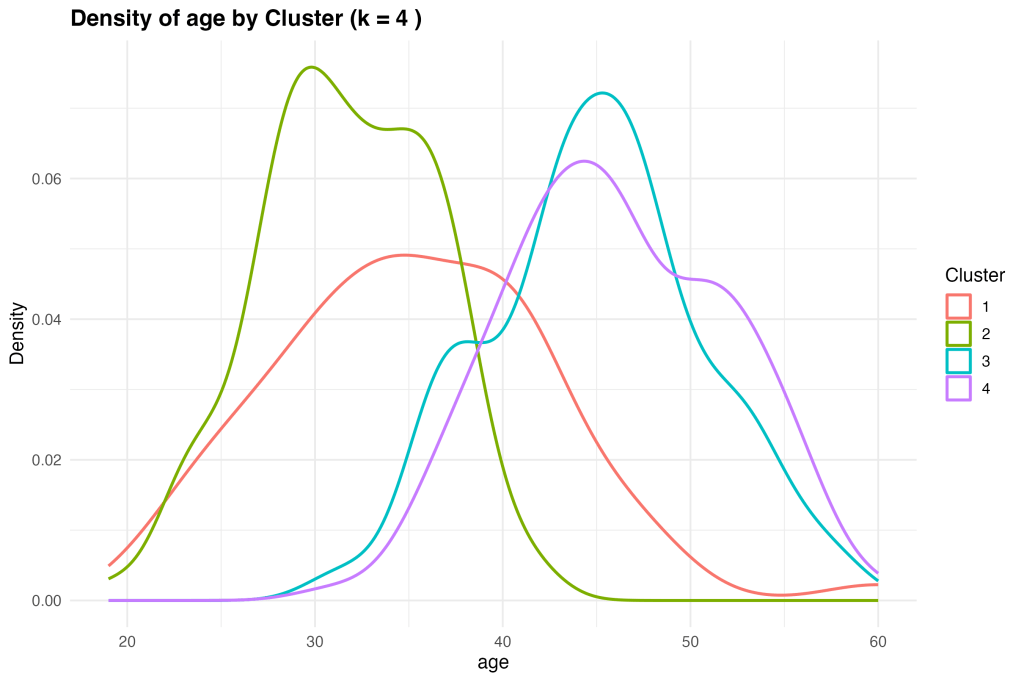
Base on these inputs, my team find a good pattern to make Cluster 3 as our GO-TO-Market Primary Target. we had data-driven clarity on exactly who to target and what to say, it called “explainable ai”.
All Steps Together of Use Case
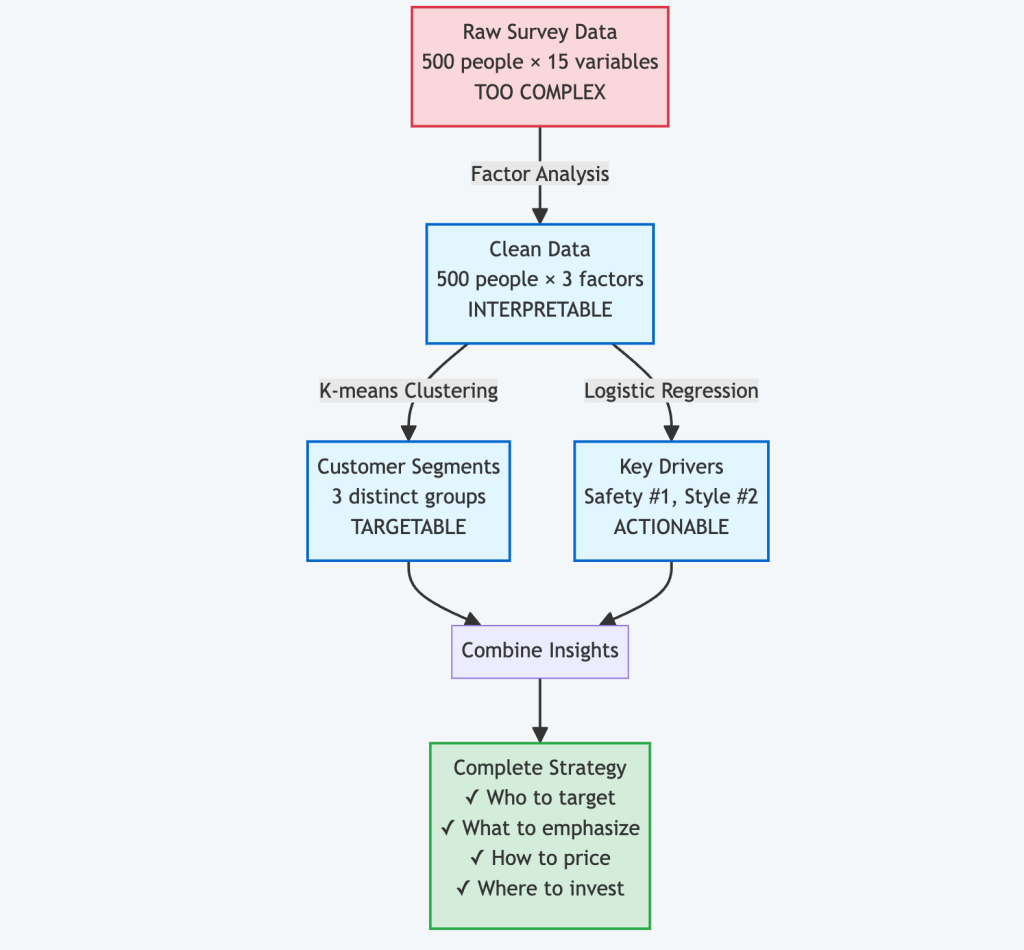
The Magic of Integration:
- Factor Analysis gave us clean, interpretable dimensions
- Clustering used those dimensions to find natural customer groups
- Logistic Regression used those same dimensions to predict success
- Together they created a complete, actionable business strategy
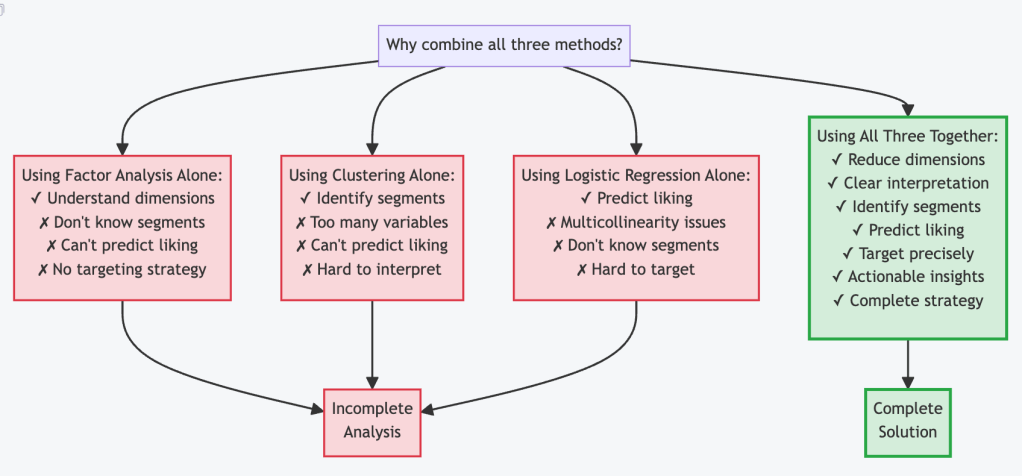
Each method reinforced the others. The factors made clustering easier. The clusters helped us understand predictions. The predictions validated our customer segmentation.

Leave a comment