Sometimes technology genuinely makes life better. That’s why I love building things.
1. Why I Built This
😩 The problem:
- My daughter was struggling with French vocabulary
- Shared Anki decks didn’t match her textbook or her level
- Most decks are dull — text-only, no images, no audio, no analysis
- Making good flashcards by hand? 20–30 minutes per word. For a 40-word unit, that’s a part-time job
🛠️ The solution:
- One weekend, 126 commits, over 800 personalized cards
- 🎨 Cartoon illustrations, 🔊 pronunciation audio, 🧬 color-coded etymology, 💡 kid-friendly mnemonics
- She opened Anki on her iPad and grinned:
“Papa, this one has a funny picture.”
The gap is not in the study app — Anki is battle-tested. The gap is in personalized content generation.
2. The Approach: Feed the Wheel, Don’t Replace It
ankids doesn’t compete with Anki. It feeds it.
Drop in any input, get back a ready-to-import .apkg file. Anki handles everything after that.
Supported inputs:
- 📝 Word lists
- 📊 Excel files
- 📄 PDF textbooks
- 📸 iPhone photos of homework sheets
Five-step AI pipeline, three core capabilities:
- 👁️ Vision models — OCR a photo of any textbook page, extract words, translations, and example sentences in one pass
- 🧠 Language models — Generate etymology, morpheme breakdowns, IPA pronunciation, cognates, and kid-friendly mnemonics at scale
- 🎨 Image & audio models — Create a cartoon illustration and pronunciation clip for every word, so a child hears and sees before they read
Output:
- 📦 A single
.apkgfile, ready to import into Anki - 🔄 Sync, scheduling, mobile, progress tracking — all handled by Anki
3. Before and After
😐 Shared deck — what most people use:
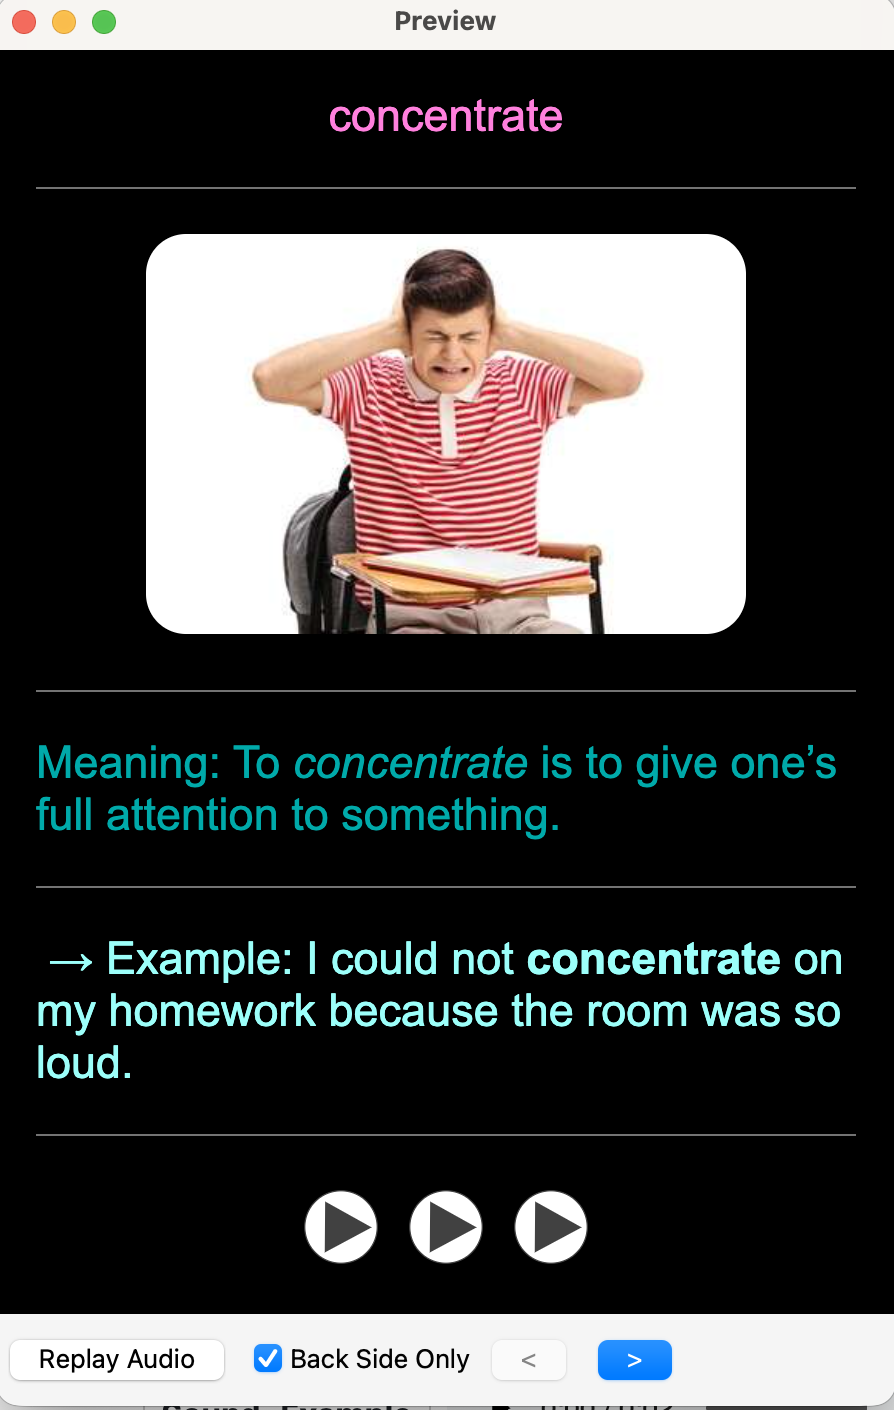
- Text-only, no images, no audio — functional but forgettable
🤩 ankids — what we generate:
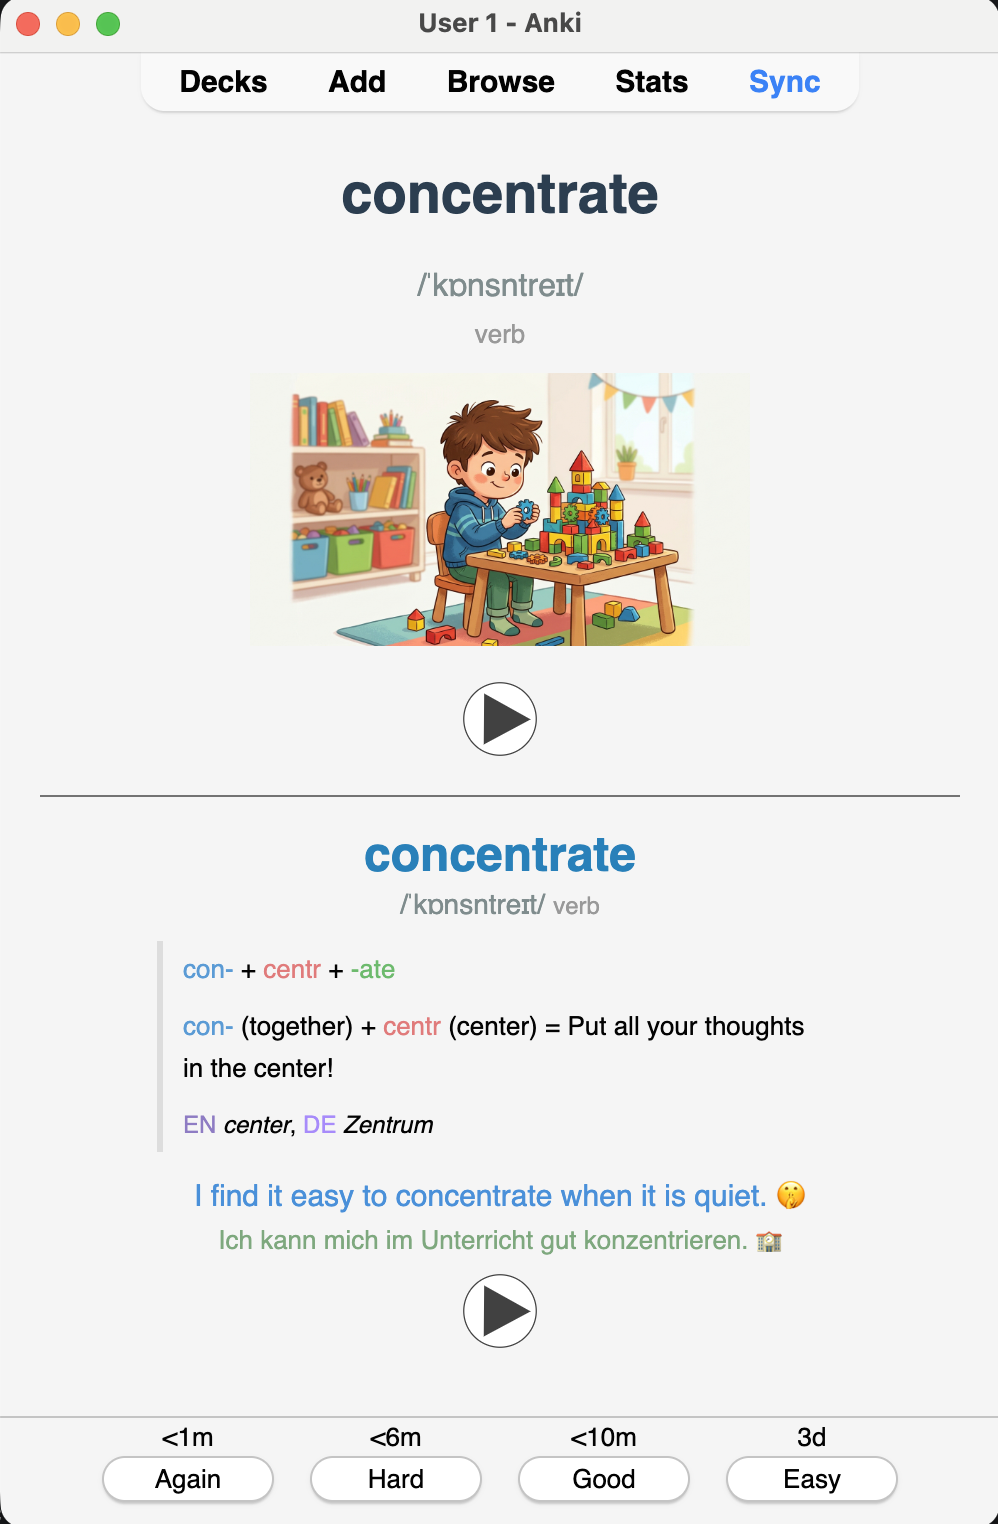
- 🖼️ AI cartoon illustration
- 🗣️ IPA pronunciation TTS audio
- 🎨 Color-coded morpheme breakdown
- 🧬 Origin chain back to Proto-Indo-European
- 🌍 Cognates across four languages
- 💡 Memory hook bilingual example sentence
A card that shows why a word looks the way it does is far easier to retain than one that just restates the definition.
4. How It Works
4.1 The 5-Step Pipeline
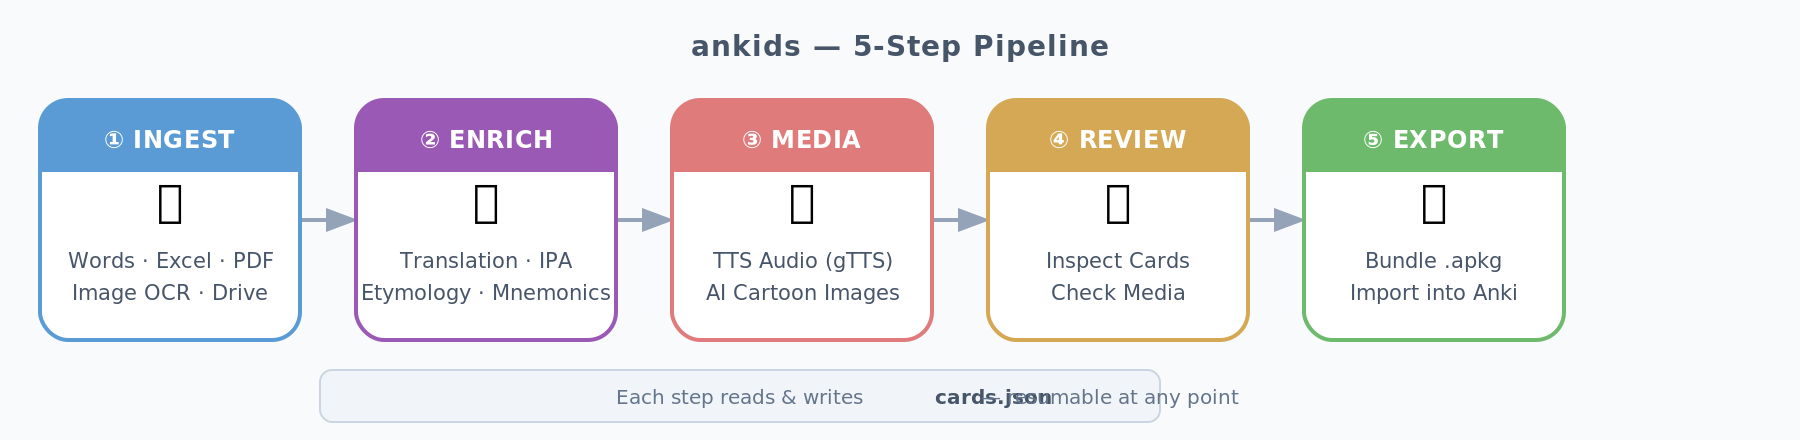
- 📄 Each step reads/writes a shared
cards.json - 🔁 Every step is independently restartable — hit a rate limit at card 847? Re-run and it resumes
4.2 Input Sources
- 📥 Six source types:
--words(CSV), Excel/CSV, PDFs, single images, image folders, Google Drive URLs - 📱 HEIC support (iPhone photos) built in — HEIC → Gemini Vision OCR → structured JSON via
pillow-heif
4.3 External Services
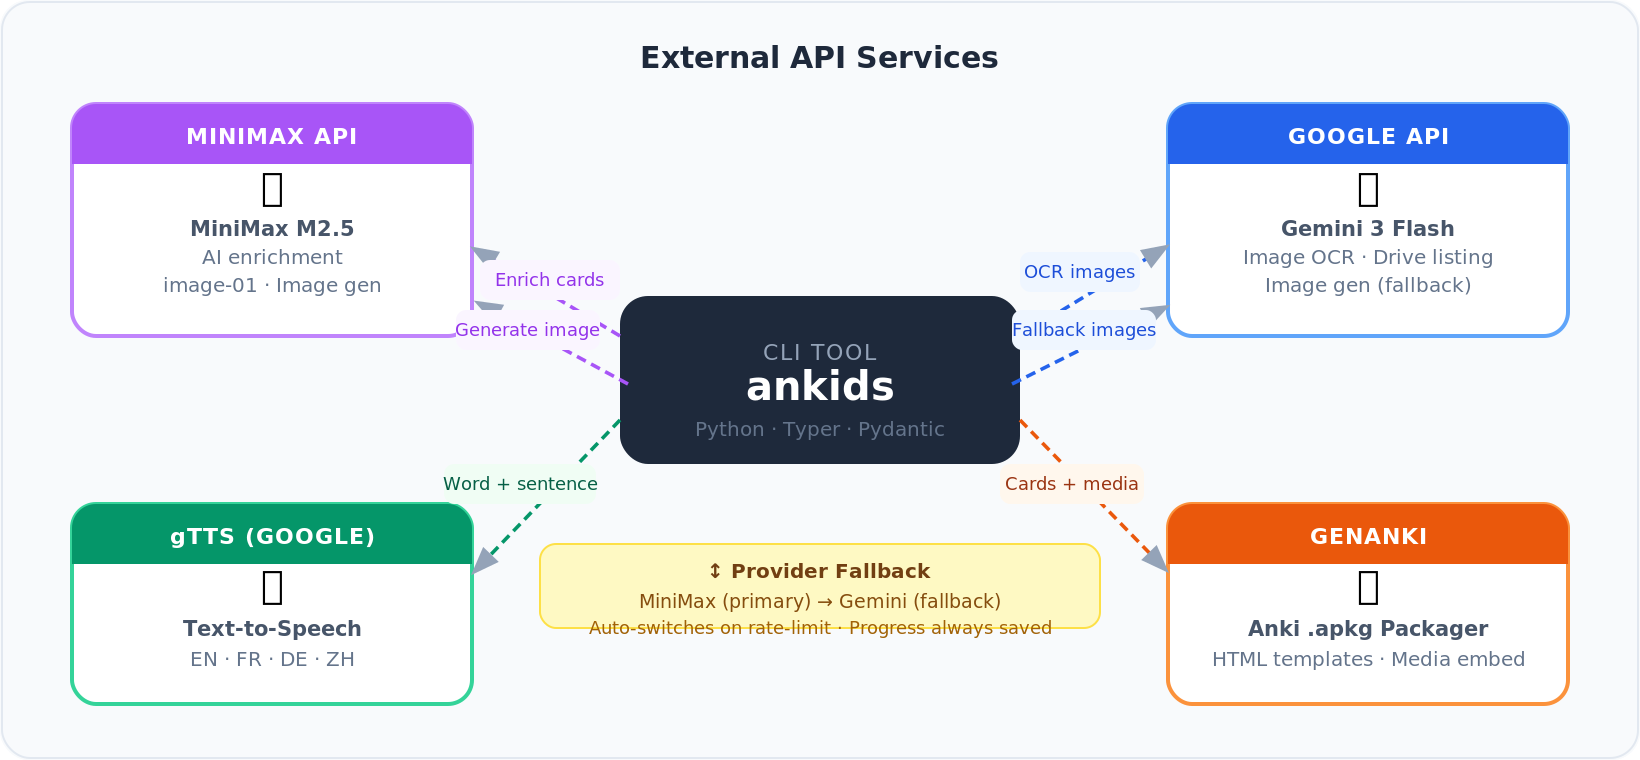
- 🤖 MiniMax — enrichment LLM primary image generator
- 🔍 Google Gemini — OCR image generation fallback
- 🔄 Auto-fallback on rate limits, progress saved between runs
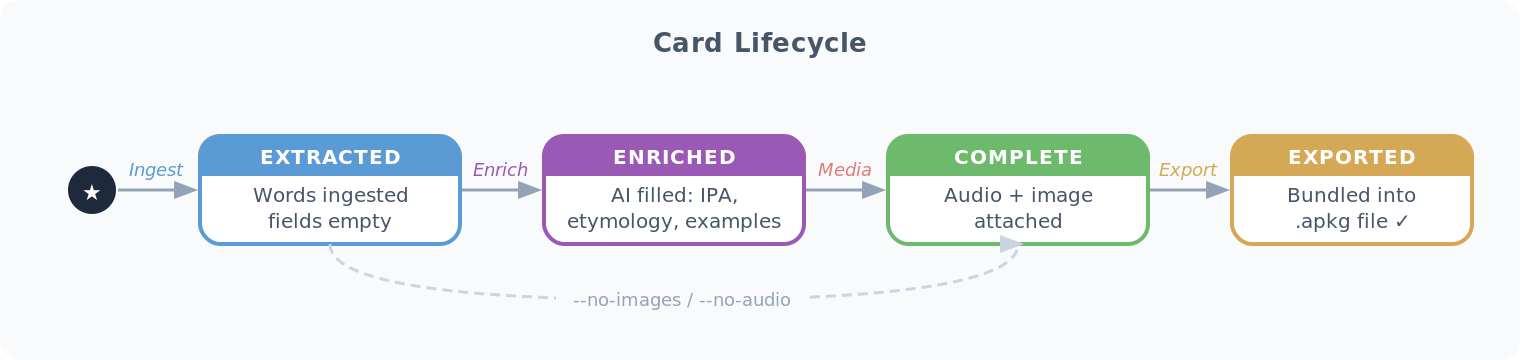
4.4 Card Lifecycle
4.5 Workspace Layout
workspace/└── a1b2c3d4/ ├── cards.json ← single source of truth ├── media/ │ ├── {uuid}_audio.mp3 ← word TTS │ ├── {uuid}_example_audio.mp3 │ └── {uuid}_image.png ← AI cartoon └── MyDeck.apkg ← ready to import
- 🔒 UUID-scoped isolation — multiple decks run in parallel, no collisions
- 💾 Workspace persists between sessions — critical for large batches
5. What Makes a Card Memorable
5.1 The Etymology Engine
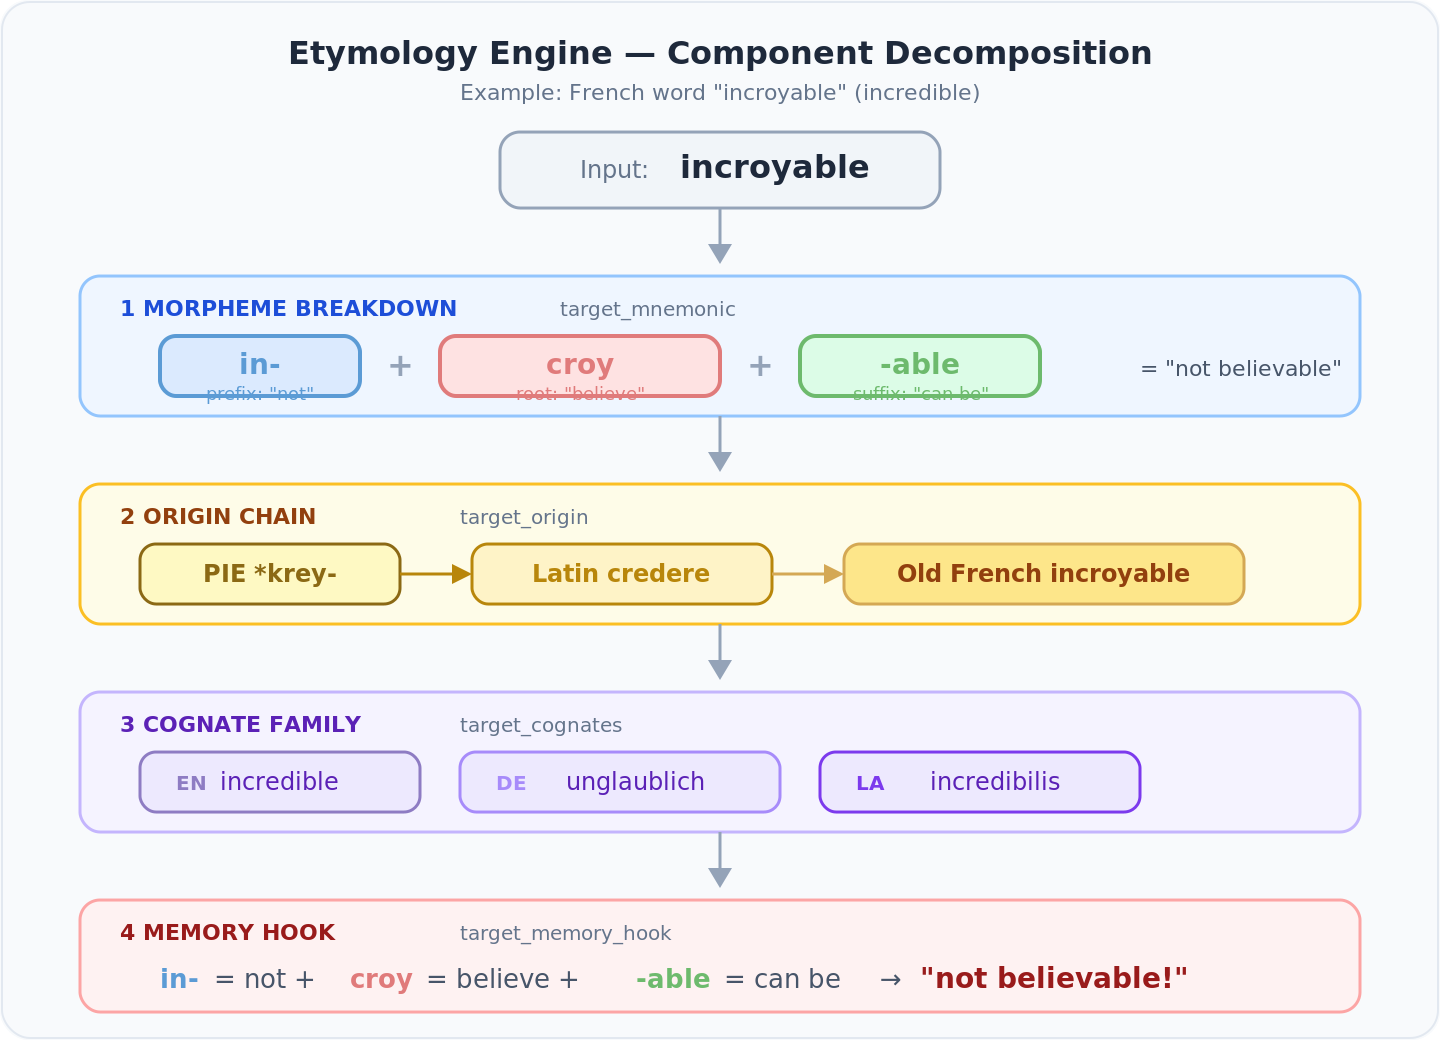
- 🧠 Most Western European words share Latin or Greek roots
- 🔍 A child who knows in- = “not” and croy = “believe” can decode incroyable without memorizing it
- 💡 That’s linguistic intuition, not rote memorization
Four fields per card, each color-coded:
| Field | Color scheme | Purpose |
|---|---|---|
target_mnemonic | Blue prefix · Coral root · Green suffix | Morpheme breakdown |
target_origin | Gold tones | PIE → Latin → Old French chain |
target_cognates | Purple tones | EN / DE / FR / Latin cognate family |
target_memory_hook | Morpheme colors | One-line hook using the breakdown |
Example — incroyable:
Mnemonic: <span color="#5b9bd5">in-</span> <span color="#e07b7b">croy</span> <span color="#6dba6d">-able</span>Origin: <span color="#8B6914">PIE *krey-</span> → <span color="#B8860B">Latin credere</span> → <span color="#D4A854">Old French incroyable</span>Cognates: <span color="#8e7cc3">EN</span> incredible, <span color="#a78bfa">DE</span> unglaublich, <span color="#7c3aed">LA</span> incredibilisMemory hook: <span color="#5b9bd5">in-</span> = not <span color="#e07b7b">croy</span> = believe <span color="#6dba6d">-able</span> = can be → "not believable!"
- 🎯 HTML renders directly inside Anki’s card template
- ⏭️ Atomic words that don’t benefit from breakdown skip the block
- 🎨 Gender coloring: masculine = blue, feminine = coral, neuter = grey — consistent everywhere
5.2 The Card Template
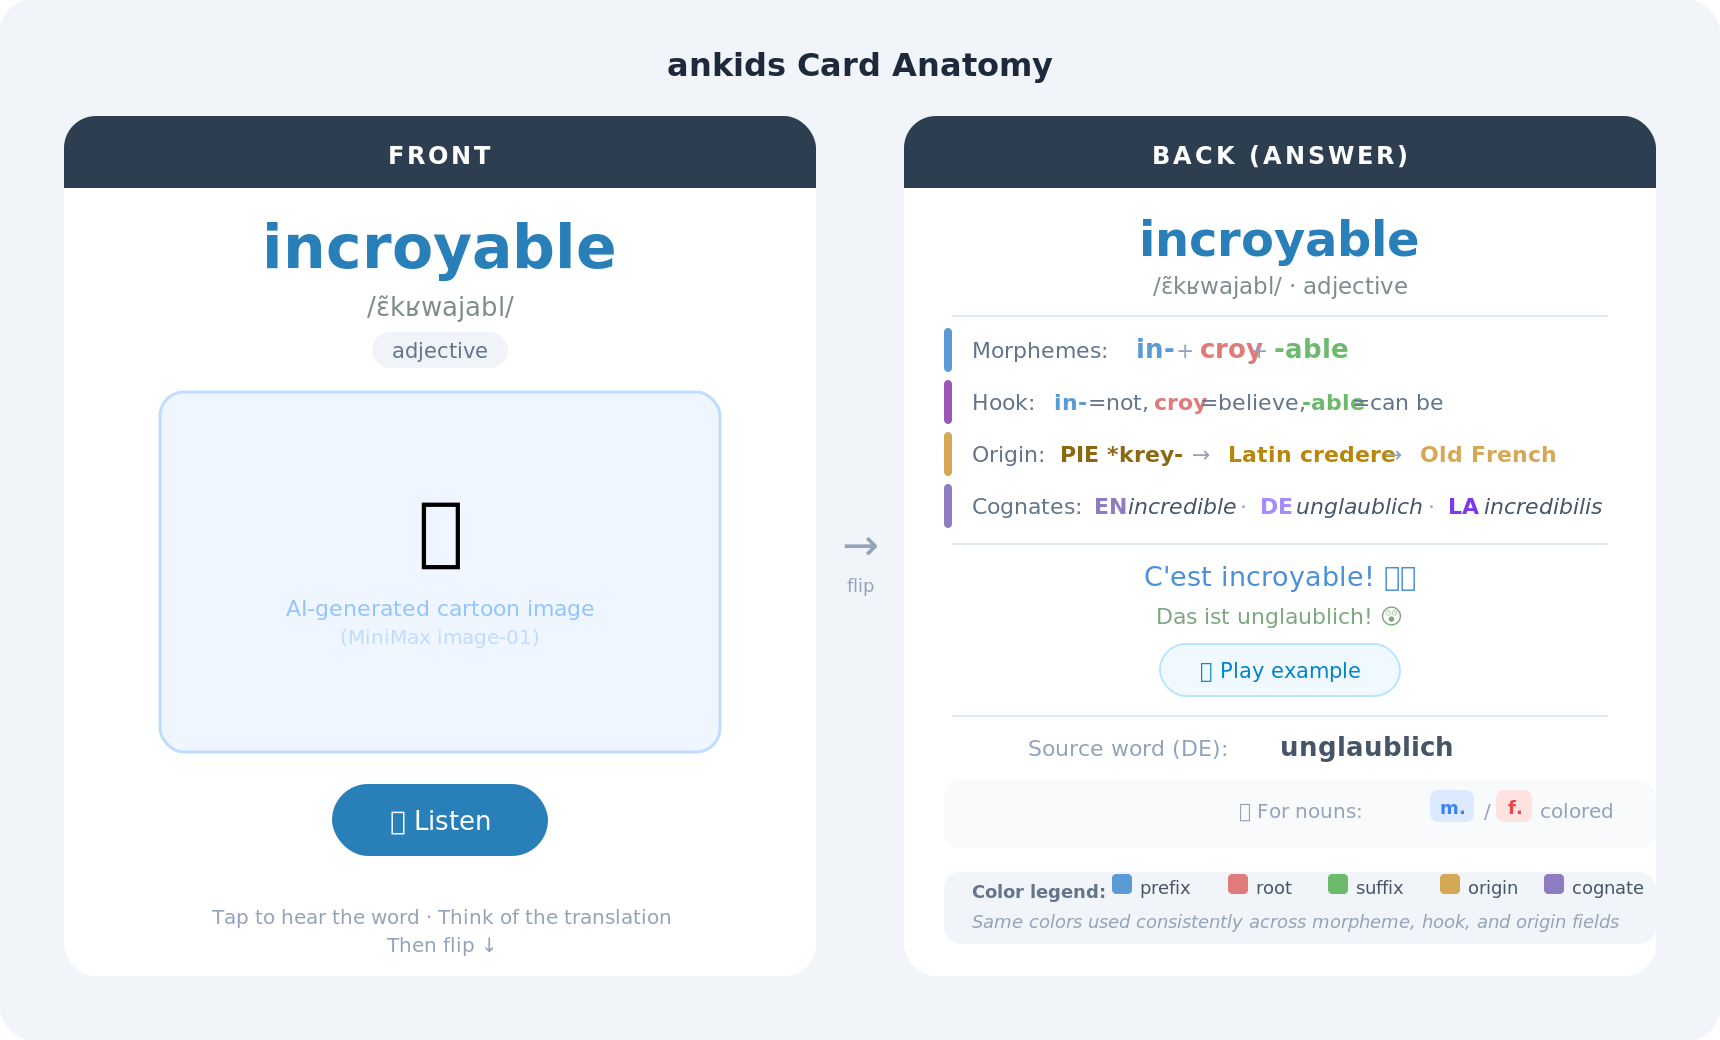
- Front: target word, IPA, part-of-speech, AI cartoon, audio button
- Back: etymology stack, example sentences with audio, source word, gender badge
- ⌨️ “Type-in” variant — shows source word, prompts learner to type the answer
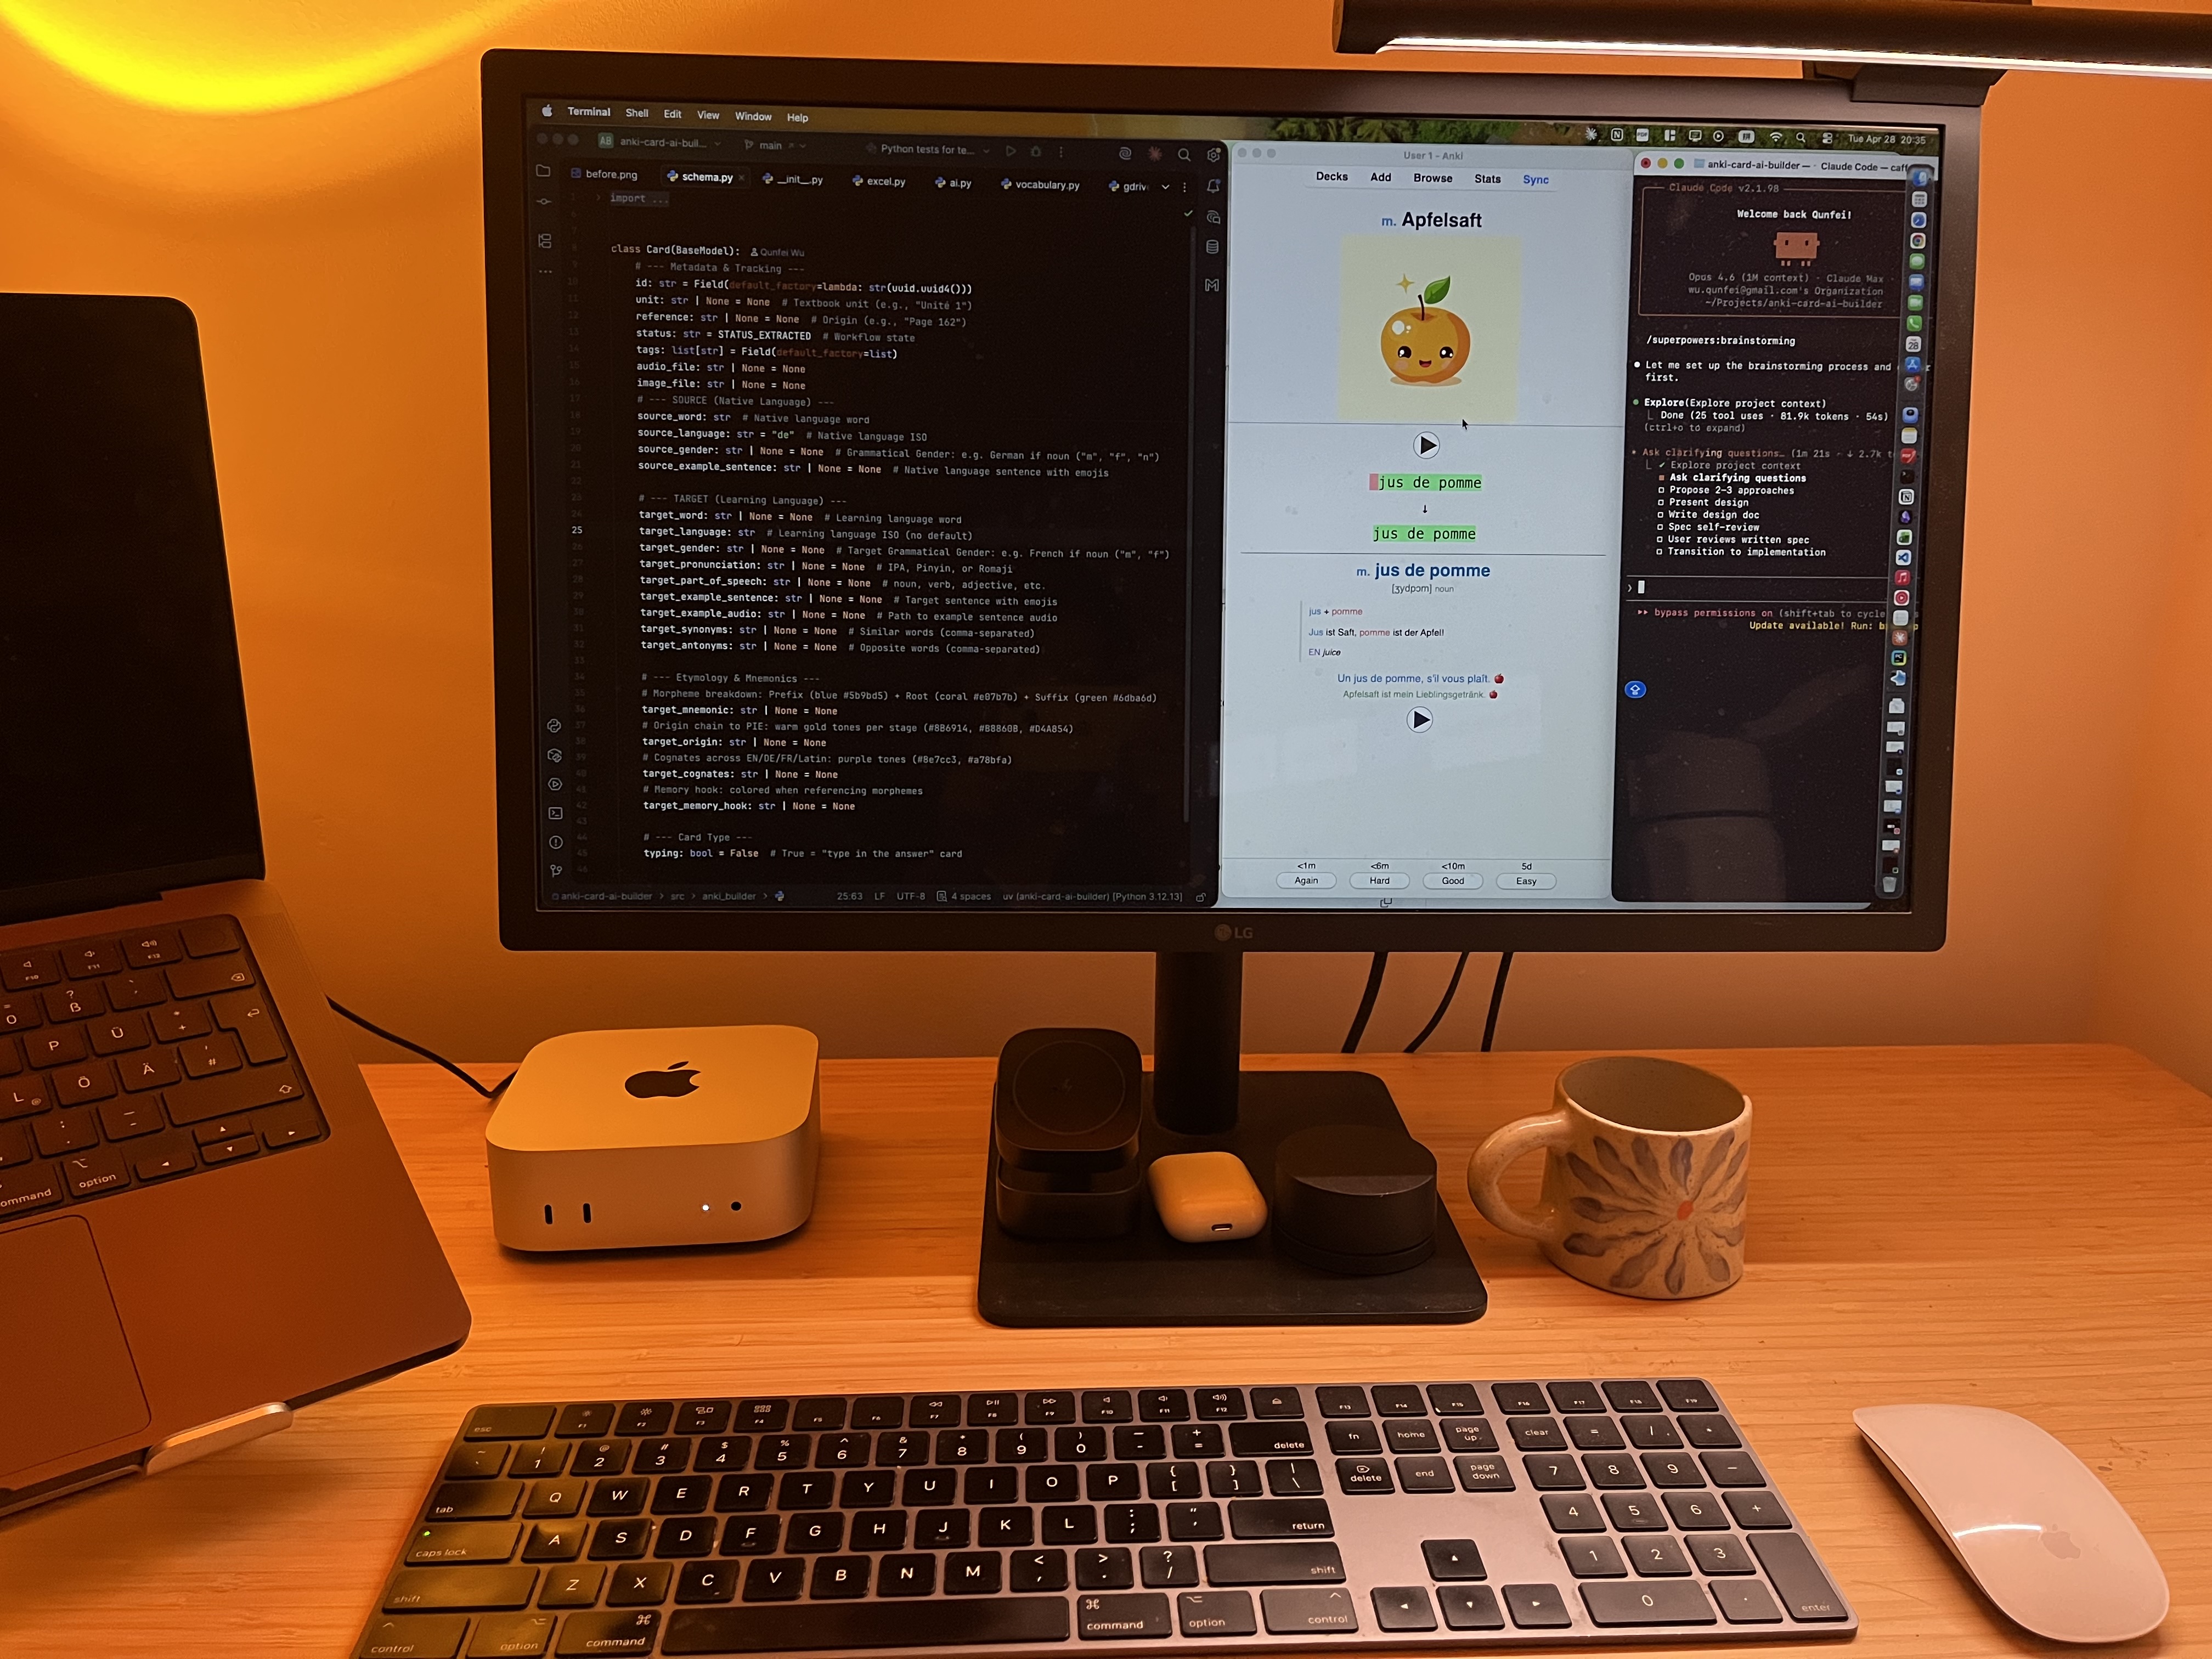
5.3 The Data Model
The Card Pydantic model is the contract across every pipeline stage:
class Card(BaseModel): id: str = Field(default_factory=lambda: str(uuid.uuid4())) unit: str | None = None # e.g. "Unité 3" status: str = STATUS_EXTRACTED # extracted → enriched → complete source_word: str source_language: str = "de" source_gender: str | None = None target_word: str | None = None target_language: str target_pronunciation: str | None = None # IPA or Pinyin target_part_of_speech: str | None = None target_example_sentence: str | None = None target_mnemonic: str | None = None target_origin: str | None = None target_cognates: str | None = None target_memory_hook: str | None = None typing: bool = False
- 🔑 Merge key:
(source_word, target_language) - 🛡️ Re-ingesting never overwrites existing enrichment or media — only adds new words
6. Building It: 126 Commits Over a Weekend
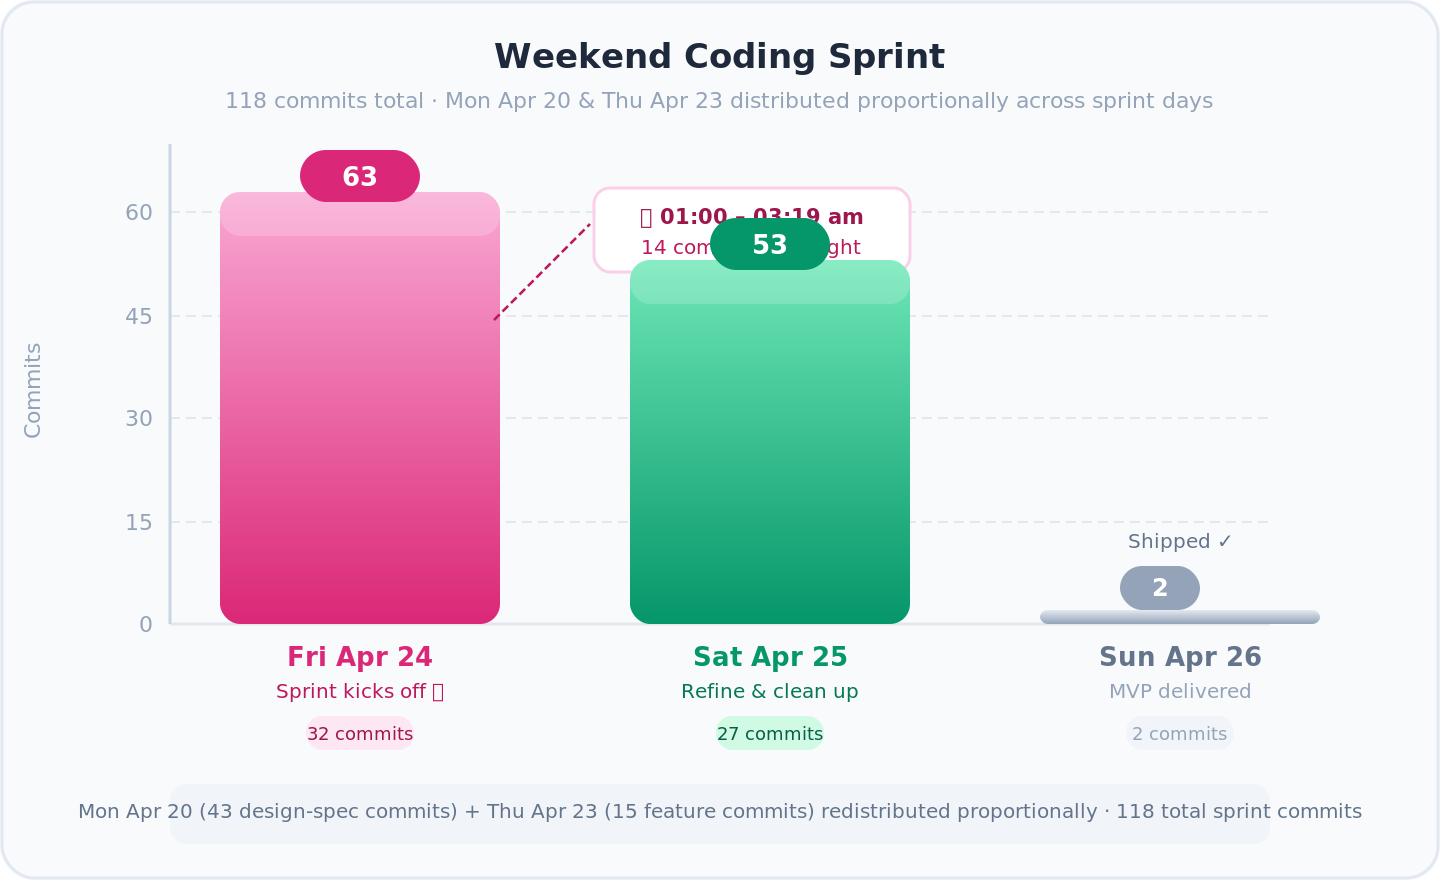
- 📐 Monday — architecture: schema drafts, prompt specs, system design. No runtime code yet
- 🚀 Thursday 21:30 — first feature live (image OCR via Gemini)
- 🌙 Friday 00:30–03:19 — 14 commits in flow state: shared constants, API key validation, error handling
- 🔧 Saturday — refinement: docs, workspace isolation, Gemini enrichment, incremental saves
- ✅ Sunday morning — MVP in the hands of the first user
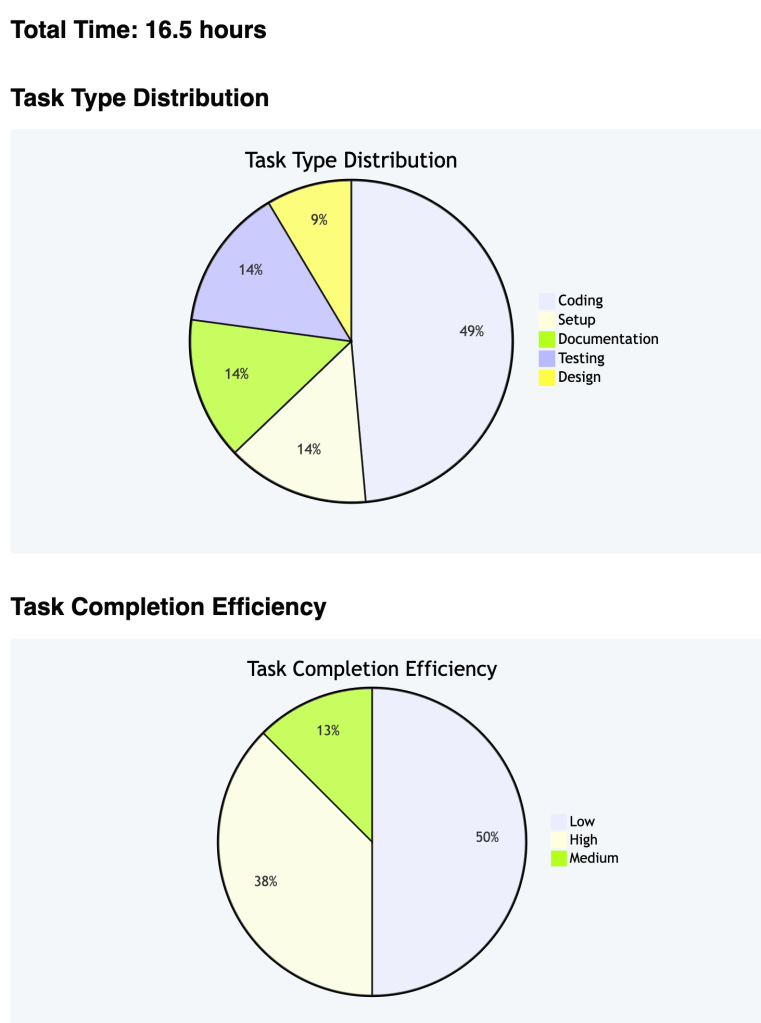
📊 Stats: 126 commits, heaviest work Thursday night → Saturday evening. Longest session: 00:30 to 03:19 while the house slept.
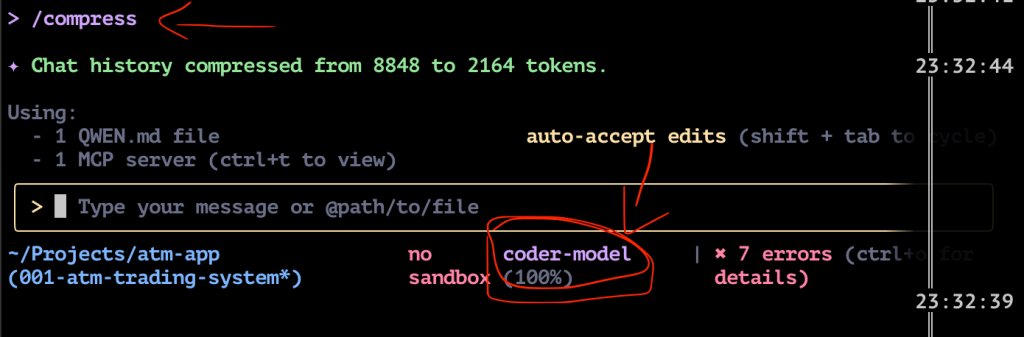
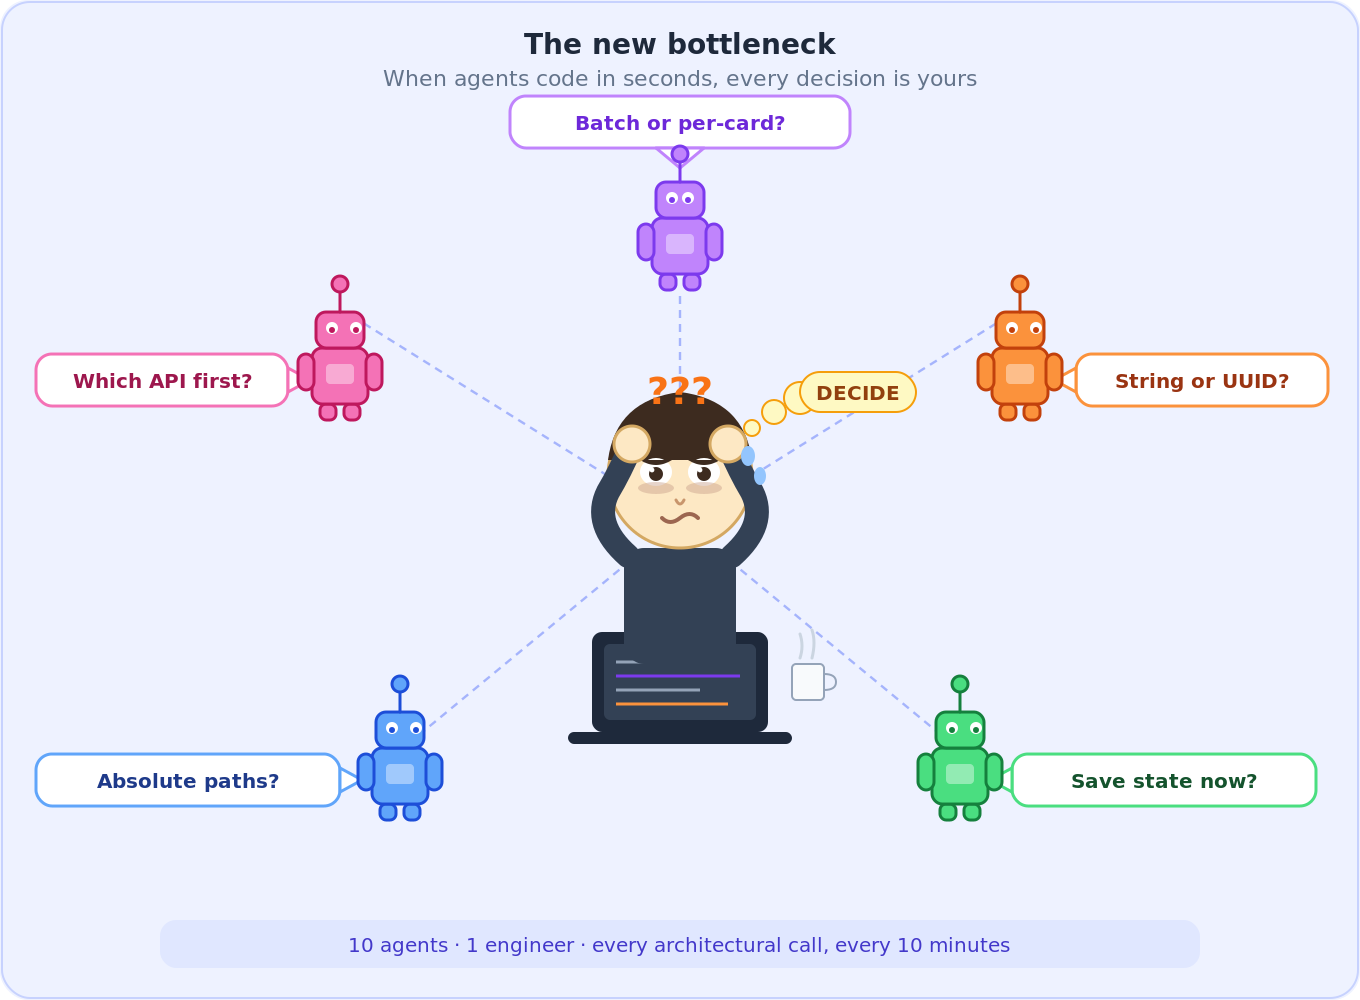
🤖 Working with 10 concurrent AI agents shifts the bottleneck. Agents produce code in seconds. The constraint becomes decisions — which design to accept, which edge case to prioritize, which abstraction to commit to. A different kind of exhaustion. It doesn’t live in your hands. It lives behind your eyes.
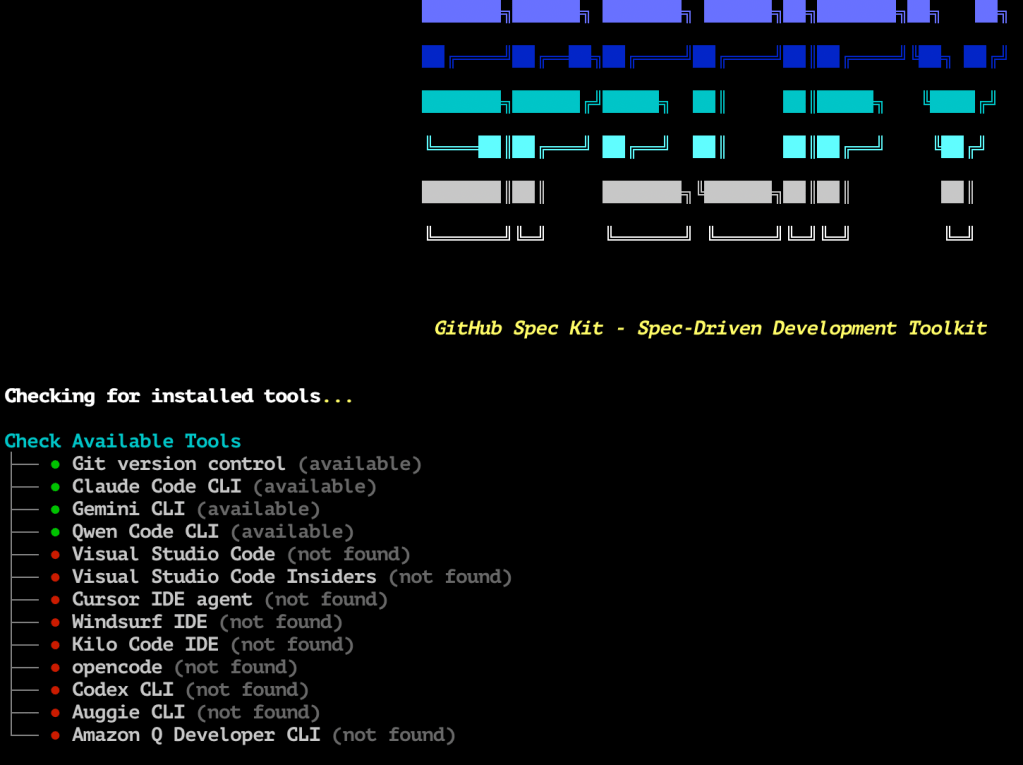
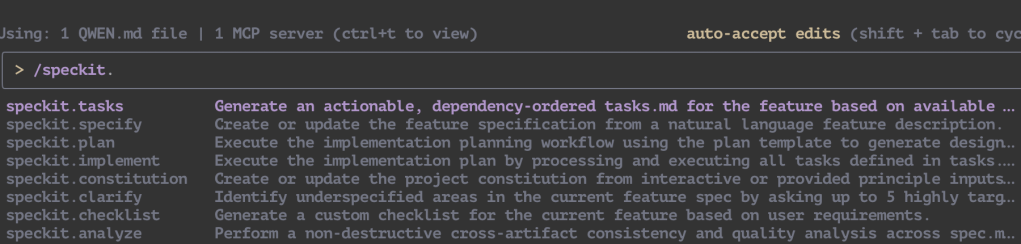
🧠 Planning with AI before coding — I used superpowers brainstorming heavily for architecture and design decisions before writing any code. Its new visual companion feature is insane — generates UI mockups and diagrams right in the terminal, so you can see what you’re building before you build it.
7. What I Learned the Hard Way
7.1 Your Laptop Is Not a GPU Server
- 💻 Mac Mini M4 (16 GB) — ran 10 parallel AI coding agents fine
- 🚫 Stable Diffusion XL, Flux, Gemma 4 — all need >16 GB VRAM
- 🐢 On shared unified memory: 1 image every 3–4 minutes. For 1,000 words = days
- ☁️ Lesson: use cloud APIs. This is a hardware constraint, not a software one
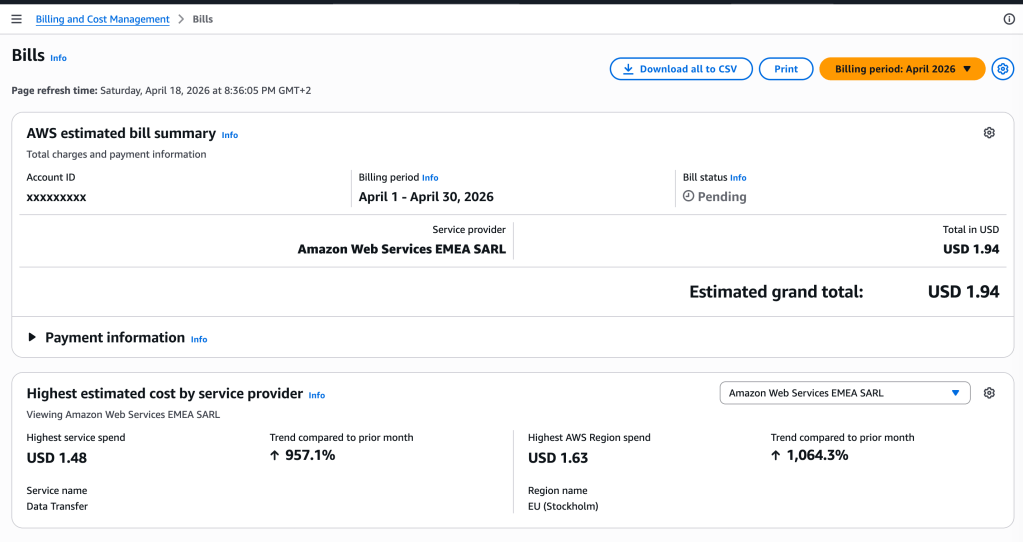
7.2 The $84 Bill
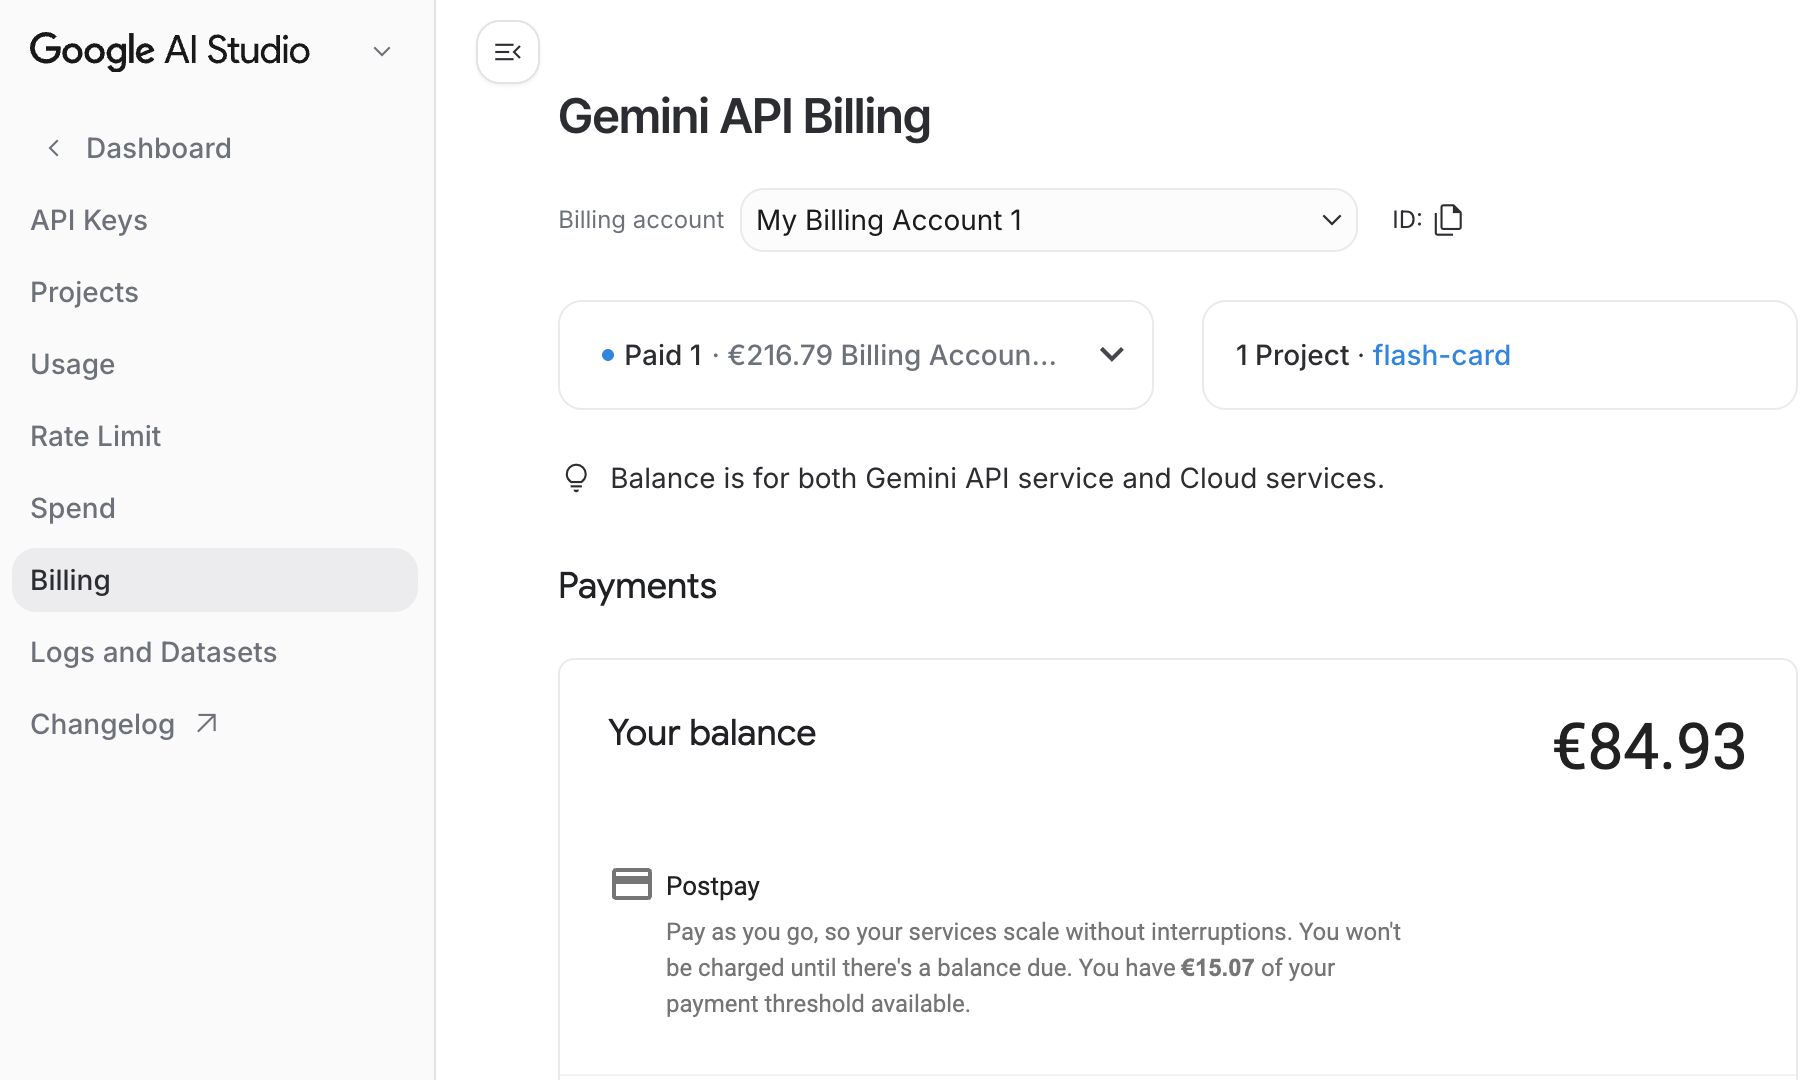
- 💸 Gemini image generation aggressive async concurrency = $84 in one Hour
- 😅 The pipeline worked exactly as designed — both impressive and alarming
- 💰 Fix: switched primary provider to MiniMax image-01 — less quality, fraction of the cost
PROVIDERS = { "minimax": _generate_minimax, "gemini": _generate_gemini,}
- 🛑 Rate-limit (
429) halts the batch gracefully and saves progress — nothing lost
7.3 AI Takes Words Literally
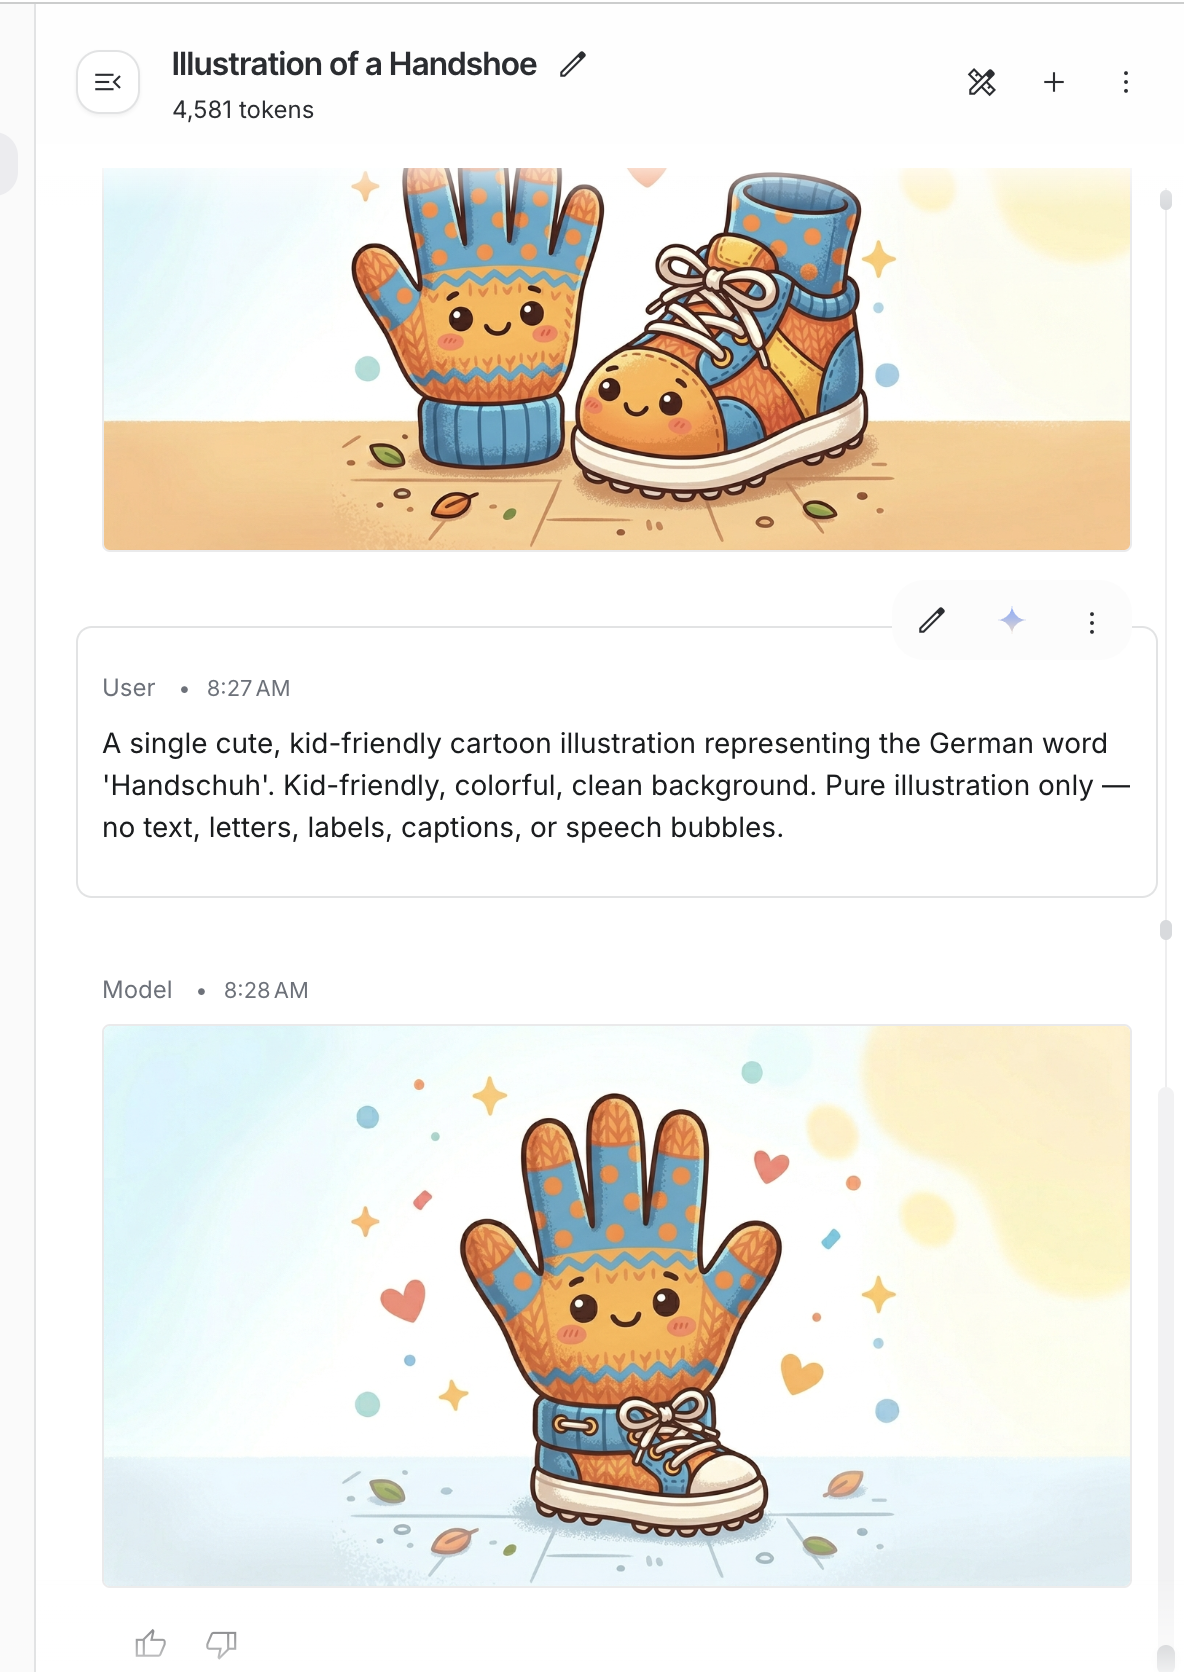
- 😂 Handschuhe = “hand shoes” (gloves). The model drew a hand and a shoe. Smiling.
- 🔧 Fix: pass the full language name tell the model to illustrate the concept, not decode the word
def _build_image_prompt(word: str, target_language: str) -> str: lang = _lang_full_name(target_language) # "de" → "German" return ( f"A single cute, kid-friendly cartoon illustration representing " f"the {lang} word '{word}'. " f"Pure illustration only — no text, letters, labels, or speech bubbles." )
- ✅ “German” instead of “de” dramatically reduced literal interpretations
- ✅ “No text” constraint stopped the model from overlaying words on images
7.4 Deleted Lines Cost Money Too
| Metric | Count |
|---|---|
| Total commits | 126 |
| Lines added | 15,558 |
| Lines deleted | 9,760 |
| Net codebase | 5,798 lines |
| Refactor / fix commits | 42 out of 126 (33%) |
- 🗑️ 9,760 deleted lines = the cost of moving fast with AI agents
- 🔄 Agents generate code without checking if a module already exists — you end up unifying duplicates
Three biggest cleanups:
"Clean the docs"— 3,505 lines deleted, 143 added"Create MVP in first day"— 3,224 lines deleted, 24 added"refactor: eliminate duplication"— 95 deleted, 230 added
💡 Lesson: run code review before adding features, not after. “Does this already exist?” saves hours.
7.5 The New Bottleneck Is You
- ⏱️ Every 10 minutes brings a design question that used to take a day of thinking
- 🧠 Batch or per-card? Absolute or relative paths? Merge by string or UUID?
- 😴 Decisions compound — bad call at midnight = refactoring at 2am
- 🏁 Finished the MVP Sunday morning, slept most of the afternoon
8. Try It
git clone https://github.com/wuqunfei/anki-card-ai-builder
# Install (Python 3.12 )
uv sync
cp .env.example .env
Minimal .env — grab your API keys first:
- 🔑 Google API Key — get one at Google AI Studio
- 🔑 MiniMax API Key — sign up at MiniMax Platform
MINIMAX_API_KEY=your_minimax_keyGOOGLE_API_KEY=your_google_keyLEARNER_PROFILE="ages 9-12, kid-friendly with emojis"
8.1 One command
# From a word listankids run --words "chat,maison,incroyable,bonjour" --lang-target fr --lang-source de# From iPhone photos of textbook pages (HEIC supported)ankids run --input ./input/french/ --lang-target fr --lang-source de --deck "Unité 3"# From a PDF textbookankids run --input textbook.pdf --lang-target fr --lang-source de# Incremental — add words to an existing workspaceankids run --words "école,professeur" --lang-target fr --output workspace/a1b2c3d4
8.2 Step by step
ankids ingest --input ./input/french/ --lang-target fr --lang-source deankids enrich --output workspace/a1b2c3d4ankids media --output workspace/a1b2c3d4ankids review --output workspace/a1b2c3d4ankids export --output workspace/a1b2c3d4 --deck "French Unit 3"
8.3 Cost controls
ankids run --words "chat,chien" --lang-target fr --no-images onlyankids run --words "chat,chien" --lang-target fr --no-audio TTSankids run --words "chat,chien" --lang-target fr --typing -in cardsIMAGE_PROVIDER=minimax MEDIA_CONCURRENCY=2 ankids media --output workspace/a1b2c3d4
8.4 CLI reference
| Command | What it does |
|---|---|
run | Full pipeline: ingest enrich media export |
ingest | Extract words from file, folder, or --words |
enrich | Fill all card fields with AI |
media | Generate TTS audio and AI images |
review | Display cards and media status |
export | Bundle into .apkg for Anki |
clean | Delete workspace and start fresh |
9. What Comes Next
The MVP works. One real user loves it. Here’s where everything stands — what’s tested, what’s not, and what’s still on the roadmap.
🔮 Planned Features — Roadmap
| Feature | Status | Description |
|---|---|---|
| 🌍 More languages | 📋 Planned | Spanish, Italian, Mandarin — prompt adjustments for Pinyin and IPA |
| 🎨 Smarter image prompts | 📋 Planned | Use target_memory_hook as image prompt to fix compound word failures (Handschuhe problem) |
| 🔄 Deck diffing | 📋 Planned | Diff-and-patch workflow with stable UUID tracking across exports |
| 📚 Curriculum planner | 💭 Vision | Generate a full semester of decks from a syllabus PDF, pre-scheduled to Anki |
10. Stack
| Layer | Technology | Link |
|---|---|---|
| 🖥️ CLI | Typer Python 3.12 | typer.tiangolo.com |
| 📐 Schema / validation | Pydantic v2 | docs.pydantic.dev |
| 👁️ Image OCR | Google Gemini 2.0 Flash | ai.google.dev |
| 🧠 AI enrichment | MiniMax M2.5 (via Anthropic SDK) | minimax.io |
| 🎨 Image generation | MiniMax image-01 / Gemini (fallback) | minimax.io |
| 🔊 Audio | gTTS | pypi.org/project/gTTS |
| 🃏 Anki packaging | genanki | github.com/kerrickstaley/genanki |
| 📄 PDF extraction | PyMuPDF | pymupdf.readthedocs.io |
| 📱 HEIC support | pillow-heif | github.com/bigcat88/pillow_heif |
| 🌐 Async HTTP | httpx asyncio | www.python-httpx.org |
| 🧹 Linting / types | ruff mypy | docs.astral.sh/ruff |
| 📦 Package management | uv hatchling | docs.astral.sh/uv |
Open source. Pull requests welcome — especially from parents who know the feeling.
github address: https://github.com/wuqunfei/anki-card-ai-builder